
64% of organisations use the Kubernetes Horizontal Pod Autoscaler to manage workload capacity, and most of those autoscaling policies scale on exactly one signal: CPU or memory utilisation. Only 20% scale on anything else. The other 80% inherited a default that was never chosen for merit. CPU became the out-of-the-box metric because it required no custom exporters, no extra API, and no additional component to operate. It was the path of least configuration, not the path of least risk. For workloads bound by queue depth, connection limits, or a downstream dependency rather than raw compute, that default now produces a specific and recurring pattern: policies that react too late, too little, or in the wrong direction, while the infrastructure bill keeps climbing regardless of which way the pods are moving.
The Trouble With CPU-Based Autoscaling Policies
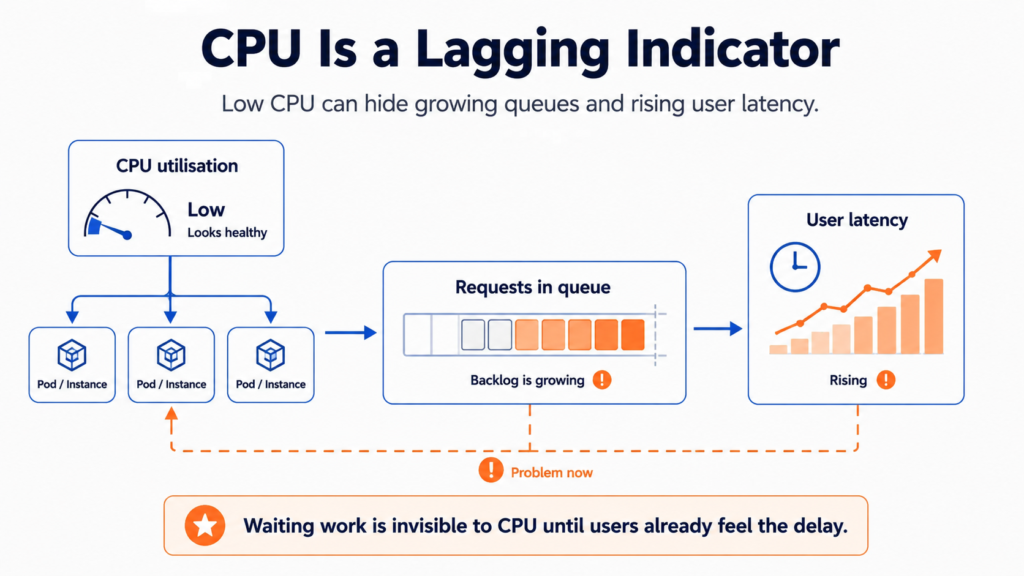
CPU and memory are lagging indicators of demand rather than measures of it. A workload constrained by connection limits or queue depth can report low CPU utilisation while its thread pool is fully exhausted and requests queue up behind it, because waiting is cheap and computationally invisible. By the time enough of that queued work turns into active processing to move the CPU needle past a scaling threshold, the requests already sitting in the backlog have accumulated the latency the autoscaler was meant to prevent. This is not a tuning problem that a lower threshold fixes. It is a structural mismatch between what the metric measures and what actually constrains the service. Message consumers, API gateways proxying slow downstream calls, and anything fronted by a connection pool tend to behave this way: quiet on the CPU graph, degraded on every latency percentile that matters, and invisible to a policy that was only ever watching one of the two.
When the Dashboard Says Healthy and the Kernel Disagrees
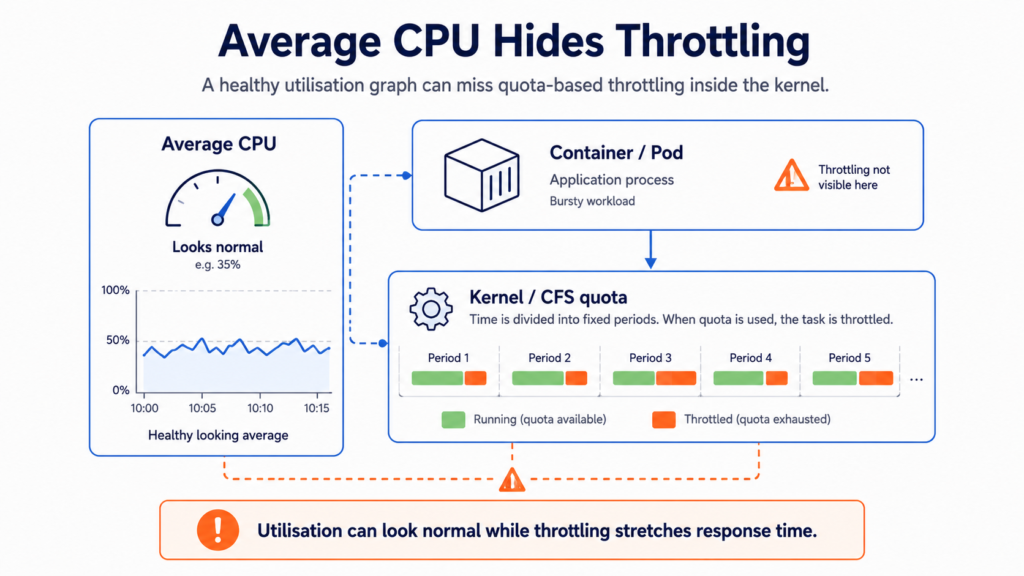
The opposite failure is just as common and considerably harder to spot. Kubernetes enforces a CPU limit through the Linux kernel’s Completely Fair Scheduler as a hard quota within a rolling window, typically a fixed number of milliseconds available in every hundred-millisecond period. A multi-threaded process can burn through that entire quota in the first few milliseconds of the period and then sit idle, throttled, for the remainder, all while the utilisation graph reports an unremarkable average. Indeed’s engineering team traced exactly this pattern in their own infrastructure: response times were degrading while CPU dashboards showed nothing unusual, because the metric being watched and the mechanism actually limiting performance were measuring two different things. Fixing the underlying throttling behaviour cut their worst-case response latency from over 2 seconds to 30 milliseconds. No autoscaling policy watching that CPU graph would ever have caught the problem, because the graph was telling the truth about utilisation and nothing at all about throttling.
Scaling Reactions That Make Things Worse
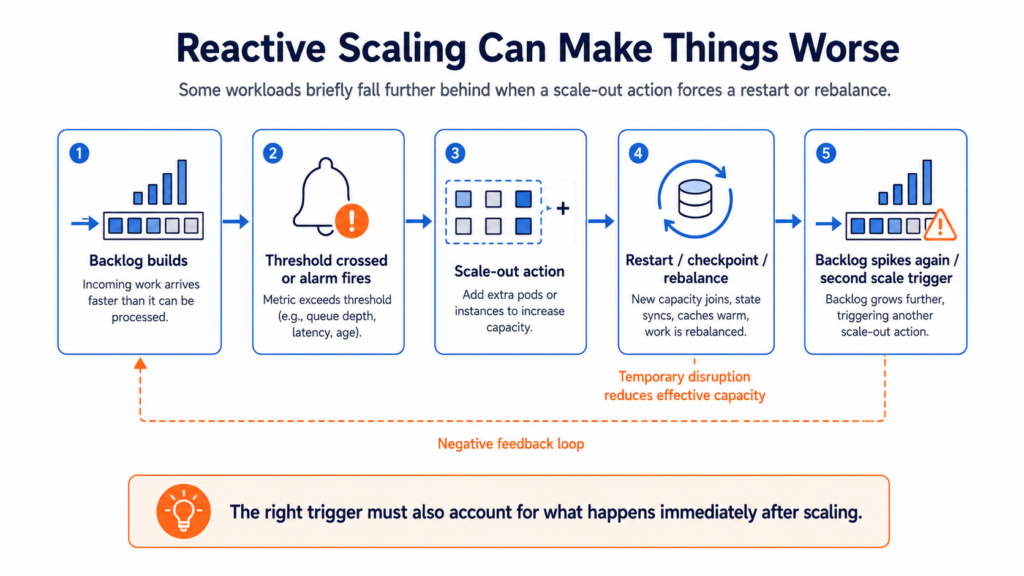
Choosing the wrong signal can also interact badly with the mechanics of the scaling action itself. Grab’s engineering team documented this while running Flink stream processing pipelines on Kubernetes, with HPA configured to react to CPU usage, consumer lag, or backpressure crossing a threshold, scaling out whenever the number climbed too high. The complication was that scaling a Flink pipeline forces a restart from the last checkpoint, which briefly adds load to the very system the scale-out was meant to relieve. A pipeline processing a busy topic would see latency rise, trigger a scale-out, restart, and briefly fall further behind before the extra capacity took effect, sometimes triggering a second reactive scaling event before the first had settled. The signal was not wrong in the sense of measuring the wrong thing. It was wrong in the sense of ignoring what happens to the system in the seconds after the autoscaler acts on it, which matters as much as what triggers the action in the first place.
The Overprovisioning Tax Nobody Line-Items
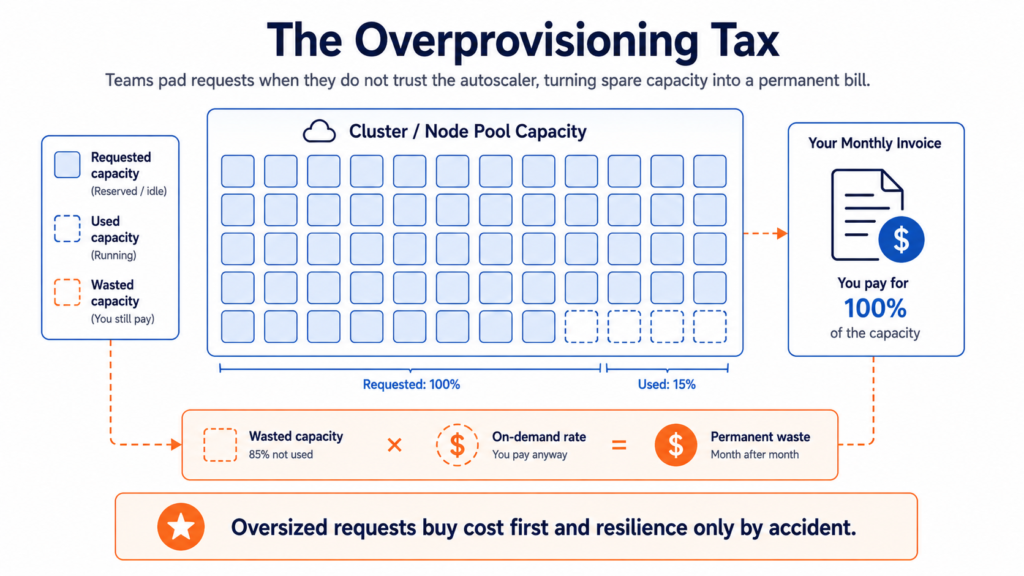
The commercial consequence of not trusting the scaling signal is overprovisioning, and the scale of it is no longer a rounding error. Cast AI’s 2026 analysis of production clusters found CPU overprovisioning has risen from 40% to 69% year on year, with average CPU utilisation across tens of thousands of clusters sitting at just 8%, a waste margin far larger than the Kubernetes cost optimisation tactics most platform teams reach for first. Teams pad requests defensively because they do not trust a CPU-based policy to react before users notice, and that padding becomes the permanent baseline rather than a temporary hedge. The counterintuitive part is that the padding does not even buy the safety it is meant to. In one cluster Cast AI examined, out-of-memory kills averaged 40 to 50 per measurement interval despite generous headroom. Automated right-sizing, the same principle behind VPA-driven right-sizing on GKE Autopilot, cut provisioned CPU in half and brought that number to near zero. The teams that stopped overprovisioning did not become less reliable. They became more reliable, because the resource requests finally reflected what the workload actually needed rather than what nobody trusted the autoscaler to notice in time.
None of this makes CPU a bad metric everywhere. Batch processing, video transcoding, and other truly compute-bound workloads scale on CPU perfectly well, because CPU is the actual bottleneck for those workloads. The mistake is treating it as the universal default rather than one option among several, chosen because AWS, Azure, GCP, and Kubernetes all put it in front of you with zero extra configuration. Queue depth, backlog per instance, concurrency, and request latency exist as scaling signals precisely because someone worked out that CPU did not match their bottleneck, and the tooling to use them, from CloudWatch metric math to Kubernetes external metrics adapters, is no longer the operational burden it was five years ago. The useful audit is not whether your autoscaling policies work. It is whether the metric driving each one was ever chosen deliberately, or whether it just arrived that way and nobody has checked since.
Useful Links
- Kubernetes documentation: Horizontal Pod Autoscaling
- Datadog: scaling Kubernetes workloads on custom metrics
- Cast AI: 2026 State of Kubernetes Optimization Report
- Indeed Engineering: Unthrottled, fixing CPU limits in the cloud
- Grab Engineering: machine learning predictive autoscaling for Flink
- AWS documentation: scaling policy based on Amazon SQS
- KEDA: Kubernetes Event-Driven Autoscaling