
CDN deployment is the most common first response to a slow application. Point a CNAME at a vendor, watch the dashboard metrics improve, and close the performance ticket. For a while it works, because a CDN helps with the fraction of traffic it can serve from cache. The problem is that fraction is smaller than most teams realise, it varies dramatically depending on application type, and the traffic the CDN cannot cache continues flowing to the same slow origin. A CDN does not fix performance problems. It defers them behind a layer of edge infrastructure that produces encouraging aggregate numbers.
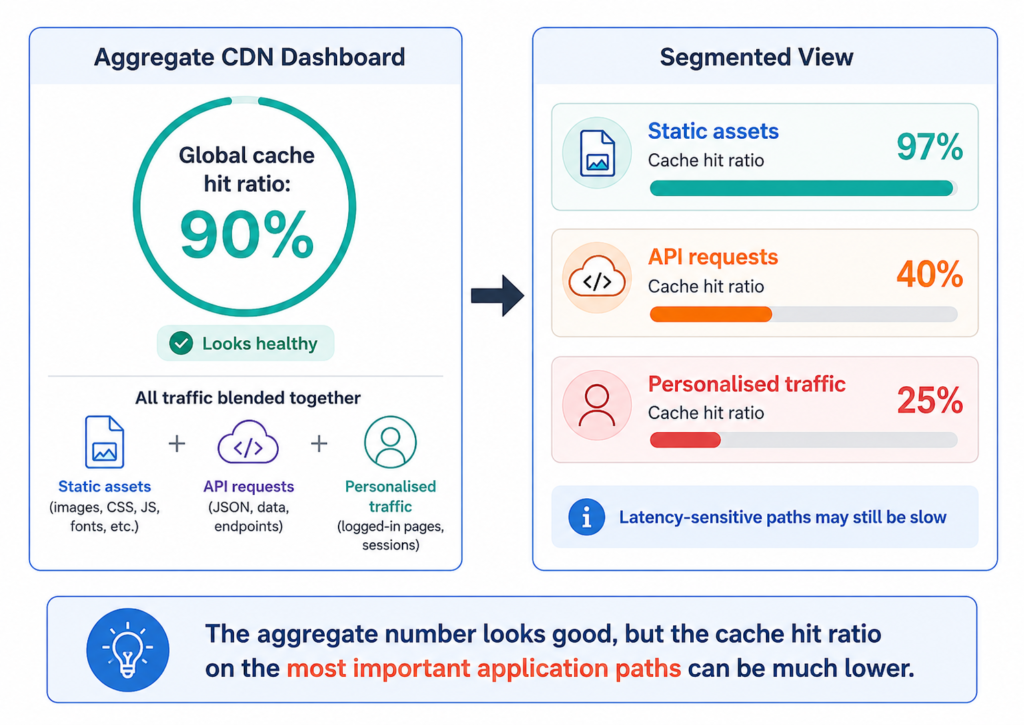
The 95-99% cache hit ratio cited for CDN deployments applies to a specific class of workload: static-content-heavy sites serving identical resources to large volumes of anonymous users. Media platforms, file delivery services, and marketing sites fit this pattern well. Enterprise applications do not. A platform with authenticated users, personalised dashboards, and API-heavy traffic will typically achieve cache hit rates of 20-40% on its most latency-sensitive paths. The headline aggregate can still appear healthy, at 85-90%, because it blends high hit rates on static assets with much lower rates on application traffic. A 95% global hit ratio can mask a 30-60% ratio at API endpoints, which is precisely where latency-sensitive transactions occur. Segmenting cache hit metrics by content type rather than reading the aggregate figure is the analysis most teams never perform before concluding their CDN is working.
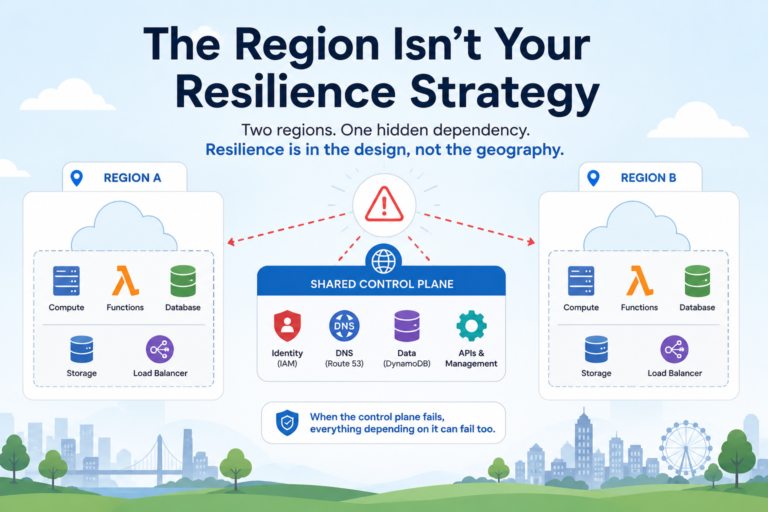
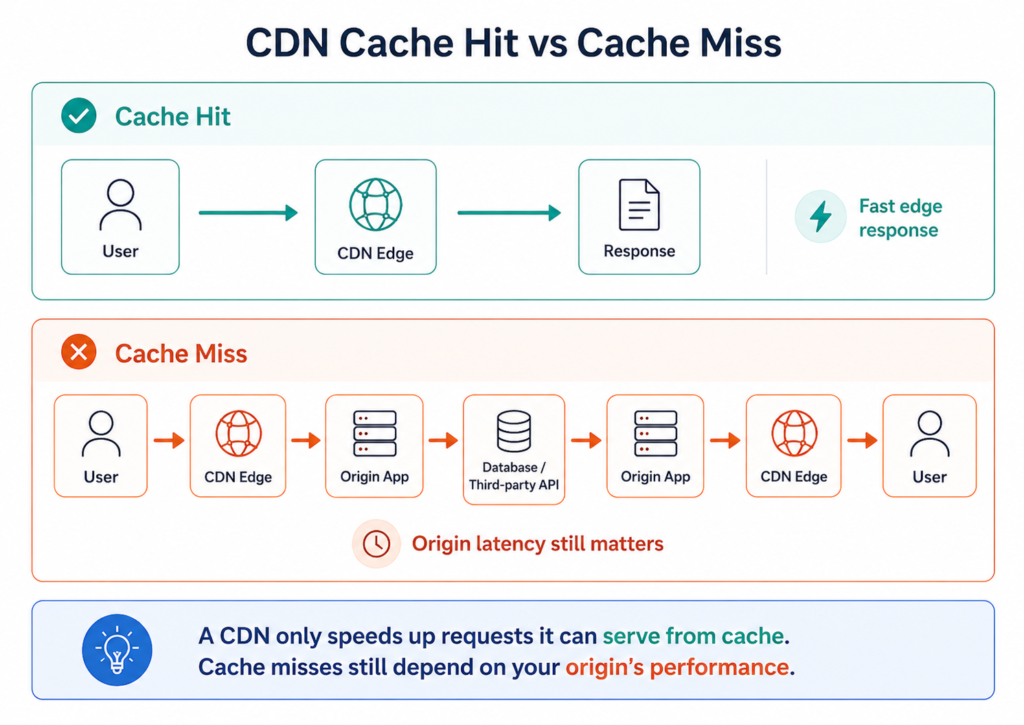
On a cache miss, which covers every authenticated API request, personalised response, or real-time data fetch, the CDN adds hops rather than removing them. The request travels to an edge node, the edge establishes a connection to origin, the response returns along the same path, and the user waits through two legs of network transit instead of one. For workloads where a significant proportion of requests cannot be cached, that additional network overhead on misses regularly negates the geographic latency saving on hits. This matters most for applications serving a geographically concentrated user base from a nearby region. The geographic distribution assumption that makes edge delivery valuable as a performance tool, as explored in our multi-region cloud architecture guide, requires the users and the origin to be meaningfully far apart. When a platform serves UK enterprise customers from a West Europe region, Singapore edge nodes are not reducing latency for those users; on uncacheable requests, they are adding routing overhead.
What CDN Monitoring Conceals
The more consequential failure is what CDN monitoring actively discourages teams from investigating. CDN dashboards report edge response times. When 80% of requests are cache hits returning in 20ms, the aggregate response time looks excellent. The 20% of requests hitting origin with 400ms database queries, N+1 call patterns, or synchronous third-party API lookups are averaged in. The team sees “average response time: 70ms” and considers the performance problem resolved. The slow query that would have triggered an optimisation sprint is now invisible behind a clean dashboard. This is the mechanism by which CDN deployment makes performance problems harder to diagnose over time: origin degradation continues, but edge metrics remain stable. The measurement that matters is origin TTFB for uncacheable requests, captured directly at the origin and not inferred from CDN reporting.
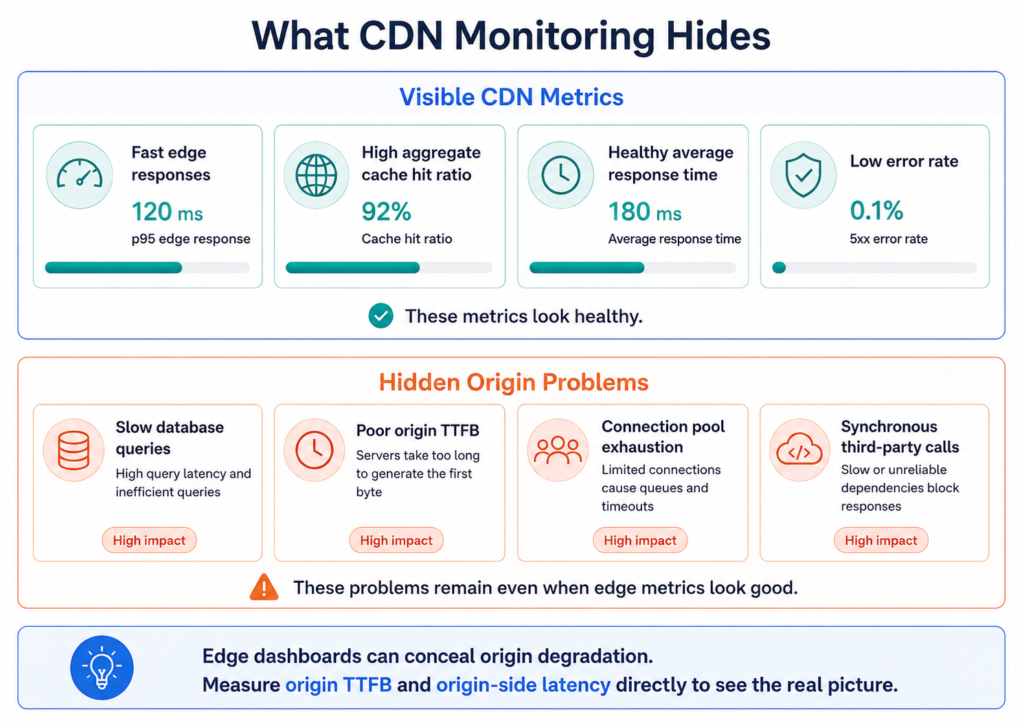
The performance problems CDN deployment typically masks share common root causes: slow database queries, absent application-level caching, connection pool exhaustion, and synchronous operations that should be asynchronous. Fixing the most expensive queries, identified through slow query log analysis, typically accounts for the majority of measurable origin latency improvement without touching infrastructure. An in-memory cache for frequently read, non-user-specific data reduces origin load more effectively than CDN configuration for workloads where data changes faster than TTLs allow. CDNs remain the right tool for what they handle well, and the edge compute capabilities covered in our AWS edge computing guide illustrate how CDN infrastructure can be used to move computation, not just cache data, closer to users. That is a meaningfully different design from deploying CDN as a layer above a slow origin.
CDNs earn their cost for what they do well: static asset delivery, geographic latency reduction for cacheable content, and network-level traffic absorption at scale. The mistake is treating CDN deployment as a performance strategy rather than one component of a performance posture. The teams that navigate this correctly start from origin TTFB, segment their traffic by cacheability before drawing conclusions, and fix origin problems at origin. That work is less visible than a CDN deployment, but it is where the performance problem actually lives. The teams that do not end up in a familiar position: an application slower than users can tolerate and a CDN dashboard reporting that everything is fine. The CDN is not misrepresenting the situation. It is reporting accurately on the requests it controls. The rest are still going to the same slow origin.