
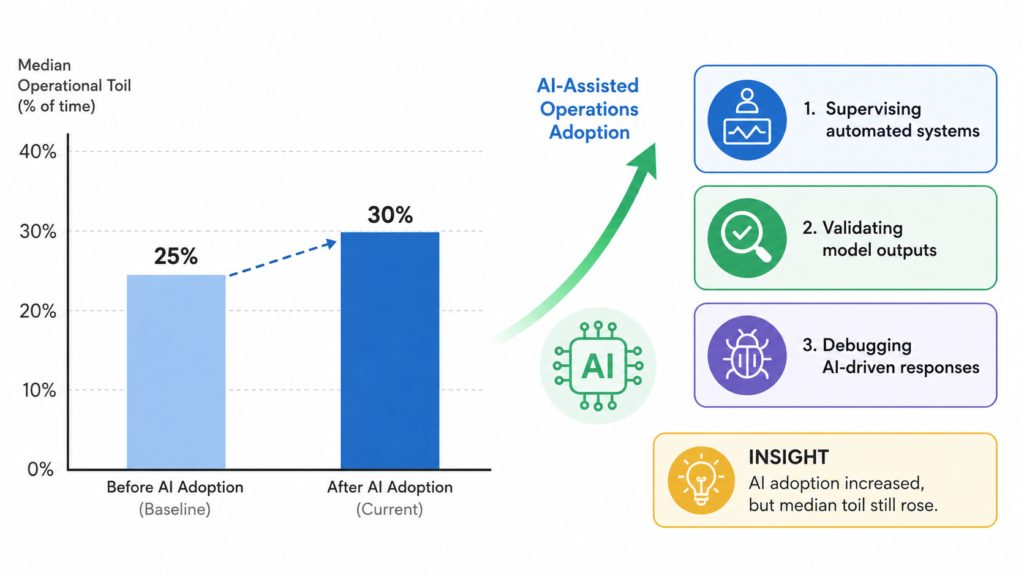
Catchpoint’s SRE Report 2025, now in its seventh year of tracking the profession, reported something unexpected: operational toil rose for the first time in five years. Median toil time across 301 site reliability practitioners climbed from 25% to 30% of working hours over the previous survey cycle. This rise coincided with the widest adoption of AI-assisted operations tooling the industry has seen. The expectation, stated explicitly in the report, was that AI would reduce toil through automated remediation and intelligent alert routing. Instead, engineers reported spending meaningful time supervising automated systems, validating model outputs, and debugging AI-driven responses that occasionally made incidents worse. A decade after Google published the book that defined site reliability engineering as a discipline, and three years into an era of AI-augmented operations, something about how organisations are implementing SRE practice is not working.
The failure mode is consistent and diagnosable. Ask an engineering leader in an organisation that has adopted SRE practice to state the current error-budget burn rate for its most critical service. In most cases the answer is a pause, a reference to a dashboard nobody quite owns, and an admission that the budget is not used to make decisions. What the organisation has is job titles that include “SRE”, a Slack channel called #reliability, and SLO definitions in a wiki. What it does not have is the mechanism the Google handbook was designed to deliver: a shared agreement between engineering and product, backed by real authority, that reliability governs release velocity when the two come into conflict. The technical community has a name for this outcome: SLO theatre. It is more dangerous than having no SLOs at all, because it creates the illusion of reliability governance without any of the operational substance.
The root cause is a misreading of the handbook at the most consequential level. The canonical SRE texts were written by an organisation running thousands of services with dedicated reliability engineers, a sub-10% SRE-to-developer ratio, and the structural authority to halt product launches when an error budget is exhausted. These conditions do not describe a 30-person platform engineering team running 40 services. The good news, buried in the SRE Workbook‘s team lifecycle chapter, is that Google’s own authors say as much: “Even if you don’t have SREs, you can adopt SRE practices by using SLOs.” The transferable unit is the practice, not the organisational model. The Home Depot demonstrated this most clearly. Working directly with Google’s Customer Reliability Engineering team, they instrumented more than 800 services with SLO measurement and treated error-budget enforcement as an explicitly aspirational next phase rather than a current capability. The sequencing is the answer.
What the Handbook Actually Assumes
Site Reliability Engineering: How Google Runs Production Systems was published in March 2016; The Site Reliability Workbook followed in 2018. Both emerged from a discipline that dates to 2003 at Google, when Ben Treynor Sloss was asked to run a production team and defined SRE as “what happens when you ask a software engineer to design an operations function.” The books were written to solve a specific problem: how to scale operations sublinearly as a service estate grows exponentially, using a pool of software engineers with reliability specialisms who are scarce enough that their time must be actively protected against being consumed by operational toil.
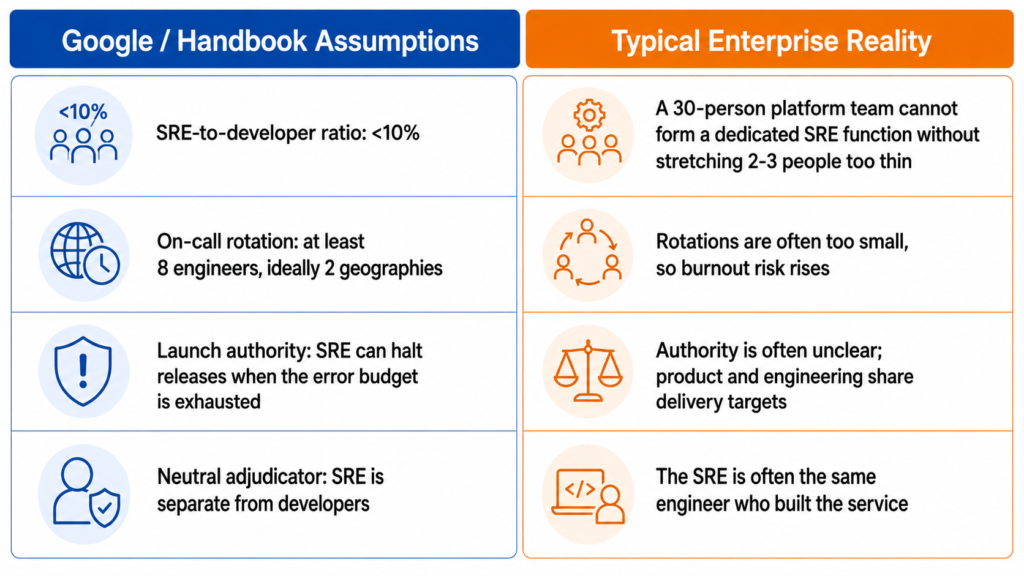
Four assumptions baked into that framing matter for any reader outside a hyperscaler context. The first is the headcount ratio: Google maintains SRE-to-developer headcount below 10%, which means a 30-person platform team cannot carve out a dedicated reliability function without producing a sub-team of two or three people who are simultaneously expected to sustain a humane on-call rotation, perform systematic toil analysis, and still do the engineering work that reduces toil long-term. The maths does not work at that scale. The second assumption is the on-call minimum: the handbook recommends at least eight engineers per rotation, ideally split across two geographic locations. For most enterprise platform teams, this threshold is unattainable without accepting chronic burnout or outsourcing the function. The third is launch authority: the Google model assumes the SRE team holds the power to halt product releases when the error budget is exhausted, a power that in organisations where engineering and product share a VP and the same quarterly delivery targets rarely exists in any operational sense. The fourth is the neutral adjudicator: the handbook positions the SRE team as an independent party arbitrating SLO compliance, distinct from the developers whose release velocity it governs. On a platform team of 20, the person in the SRE role is frequently also the engineer who built the service.
None of this makes the handbook wrong. It makes it a scaling artefact, designed for a specific problem at a specific scale, that requires deliberate and systematic adaptation before it applies to almost any other context.
The Three Concepts: Where the SRE Implementation Gap Appears
The handbook spans hundreds of pages, but three concepts carry the weight of any serious SRE adoption programme: service level objectives paired with an error-budget enforcement policy, toil measurement and elimination, and on-call structure combined with blameless incident review. Each concept transfers to non-Google scale. Each requires a different kind of adaptation to do so.
Service Level Objectives and the Error Budget Policy
An SLO sets a target reliability level from the user’s perspective; the error budget is the permitted unreliability expressed as 1 minus that target. For a service with a 99.9% SLO, the monthly error budget is roughly 43 minutes of downtime, or the equivalent expressed as an error rate against total request volume. The Workbook‘s error-budget policy template specifies the enforcement mechanism: feature releases freeze when the budget is exhausted, a postmortem with a P0 action item is mandatory for any single incident that burns more than 20% of the monthly budget, and disputes escalate through defined channels. The handbook is explicit that this works only with genuine organisational commitment: “The organisation has committed to using the error budget for decision making… formalised in an error budget policy. Otherwise, SLO compliance will simply be another KPI rather than a decision-making tool.”
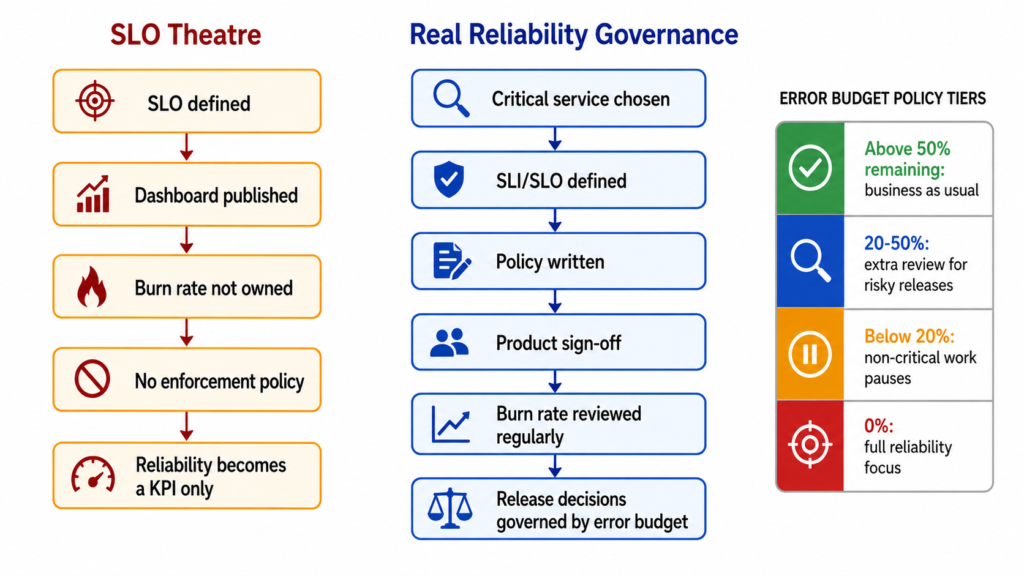
The implementation gap appears precisely at the question of enforcement. Error budgets do not remove the politics from the engineering-product relationship as the handbook promises; they relocate the politics to a more structured arena. The budget only governs behaviour if someone has the authority and the willingness to freeze releases when it is exhausted. In most organisations that authority is unclear, and engineering and product teams facing the same quarterly delivery commitments find it difficult to treat the reliability number as a hard constraint. What results is the pattern described in the opening: numbers on a dashboard, a burn rate nobody tracks, a decision nobody makes from the data.
The adapted version starts with sequencing, not scale. Google’s Customer Reliability Engineering team recommends starting with three to five SLOs per critical user journey, on a rolling 30-day window, with a tiered written policy before the dashboard is published. The tiers matter practically: above 50% remaining budget is business as usual; between 20% and 50% is additional review for risky releases; below 20% means non-critical work pauses; at zero is full reliability focus. The single most important act in the whole programme is getting product to sign the policy before any SLOs go live. Write the policy, agree it with product, then publish the numbers. An SLO without a signed enforcement policy is a metric with the word “commitment” written in the comments. The test for whether the programme is real remains the same question posed in the opening: can an engineering leader quote the current burn rate without consulting a dashboard?
Evernote’s migration to Google Cloud provides an instructive model for where to begin. Facing 220 million users and more than 750 MySQL instances, the team deliberately chose a simple opening SLO of 99.95% uptime measured monthly, probed from outside the environment via Pingdom, and treated scheduled maintenance as downtime on the grounds that users did not know about maintenance windows and would not make allowances for them. Nine months later, the team was on what it called version three of its SLO practice. Start simple, iterate, and do not design the final-state architecture on day one.
Toil Measurement and the 50% Cap
The handbook defines toil as work that is manual, repetitive, automatable, tactical, devoid of enduring value, and scales linearly with service growth. Administrative overhead, including meetings and planning, is explicitly not toil. The rule is a 50% cap: SREs should spend at least half their time on engineering work that reduces future operational burden, averaged over a few quarters. Google’s own internal quarterly surveys show average toil running at roughly 33% of SRE time, well below the cap, consistent with the theory that the cap creates the headroom needed for the engineering investment.
For a lean platform team, the 50% cap is an aspiration the organisation has not yet funded, not an operational constraint to enforce. A team of 20 managing 60 services with a meaningful on-call burden cannot credibly assert that half its time is protected for engineering work without either misclassifying toil or ignoring on-call data. The more useful framing treats the cap as a direction and an argument: if measured toil exceeds 50% for two consecutive quarters, that is the number that goes to leadership to justify platform investment or headcount. The figure is most powerful as a business case, not as a gate.
The industry picture makes the challenge concrete. Catchpoint’s SRE Report 2025 found that median operational toil rose from 25% to 30% of practitioner time, the first increase in five years, coinciding with the rollout of AI-assisted operations tooling. The expected AI-driven toil reduction has not materialised at the median: engineers report spending time supervising automated systems and validating AI outputs in ways that constitute a new category of operational work rather than an elimination of the previous one. Teams evaluating AI-assisted incident management or automated remediation should instrument their toil ratio before deployment and hold vendors accountable to a net reduction claim across the complete operational picture, not merely against the category of work the tool directly replaces.
The practical adaptation for a lean team is a one-week toil log: every recurring task recorded by frequency, duration, and risk, sorted by cost, and the top five addressed in order using the prioritisation sequence of avoid first, automate second, improve third, and delegate fourth. Track the ratio quarterly and use the trend line as the management signal. A team showing toil falling from 45% to 38% to 29% over three quarters has a stronger investment argument than a team that asserts the problem without the data to support it.
On-Call Structure and Blameless Incident Review
The handbook establishes two sustainability constraints for on-call work: a minimum of eight engineers per rotation, ideally across two geographic locations, and a maximum of two actionable incidents per 12-hour shift before the alerting system itself is treated as failing and requires a postmortem on the alerting design rather than the incidents themselves. Both thresholds are benchmarks that most platform teams cannot meet at sub-Google scale without accepting chronic burnout or reducing the on-call scope.
The burnout consequence is not theoretical. Catchpoint’s 2025 survey found that nearly 70% of SREs report that on-call stress has contributed to burnout and attrition on their teams. The mechanism is predictable: a team of four covering a 24/7 rotation with standard holiday entitlement concentrates the on-call burden on the same two or three engineers repeatedly; alert noise prevents rest during on-call windows; and the engineers most familiar with production systems are typically the first to leave when the pressure becomes unsustainable. For teams running containerised workloads at enterprise scale, as explored in the production-grade enterprise Kubernetes implementation guide, the operational complexity that makes alert hygiene essential is precisely the complexity that makes the minimum viable rotation size hardest to staff.
The viable adaptation redesigns what on-call covers before it addresses who covers it. Scoping on-call ownership tightly to what a team genuinely controls, rather than applying blanket coverage to all production services, reduces the blast radius of each shift. A tiered structure, in which service-level on-call owned by the team that built the service escalates to platform-level on-call owned by the platform team only when an incident crosses a defined threshold, allows a smaller rotation to govern a larger service estate without burning out the individuals carrying the most operational knowledge. The two-incidents-per-shift ceiling from the handbook is the real sustainability test: if a rotation consistently exceeds it, alert hygiene is the problem to fix before rotation structure is redesigned.
Blameless postmortems rest on a correct foundational principle: complex systems fail through chains of contributing causes, and assigning blame to individuals destroys the psychological safety required to surface near-misses and address systemic problems. The implementation challenge is that postmortem culture cannot be installed by policy in an organisation with blame-oriented leadership. The gap between having a blameless postmortem template and having a genuine learning culture is the gap between compliance and modelling. The adaptation that works is senior engineers and technical leads publicly attributing their own decisions to incident contributing factors, consistently and visibly, before they expect junior engineers to do the same. The simplified format that actually gets completed is a one-page document with a summary, a timeline, contributing factors framed in systems terms, what went well, and owned action items with due dates. Draft within 72 hours, finalised within seven to fourteen days, reviewed for blameful language before publication.
The Adaptation Framework: Google Model vs Enterprise Reality
| Concept | Google Model | Common Failure Mode | Enterprise Adaptation |
|---|---|---|---|
| SLOs | User-journey SLIs, quarterly policy review, CTO-level escalation on disputes | SLO theatre: dashboard without enforcement policy | One SLO, one service, signed policy before dashboard publishes |
| Error budget | Feature freeze on exhaustion, P0 postmortem at 20% single-event burn | Budget treated as advisory; burn rate unknown to leadership | Tiered policy (green/amber/orange/red); product sign-off required |
| Toil cap | 50% engineering minimum enforced via quarterly survey | Cap treated as operational rule in a team that cannot fund the automation | Track as quarterly trend; use as investment argument, not a hard gate |
| On-call | Eight-person rotation, two geographies, two incidents per shift maximum | Under-staffed rotation, chronic burnout, attrition of senior engineers | Tiered ownership (service-level + platform-level), ruthless alert hygiene |
| Postmortems | Structured template, neutral facilitation, action-item tracking | Compliance exercise; blameful language survives template formatting | One-page format, 72-hour draft discipline, senior engineers model blamelessness publicly |
Real-World SRE Implementation: Three Cases
Company Name and Industry: The Home Depot, Retail
Scale Context: Fortune-50 US home improvement retailer; SLO measurement deployed across more than 800 internal services at time of publication; programme conducted with direct involvement from Google’s Customer Reliability Engineering team
Challenge: Scaling an SLO practice across hundreds of services without dedicated SRE headcount at Google’s ratio, and without an equivalent launch-authority model to enforce error-budget consequences in production
Solution Implemented: Built an internal SLO measurement and reporting tool called VALET (Volume, Availability, Latency, Errors, Tickets) and embedded regular SLO reviews as a standing developer best practice across engineering teams
Measurable Outcomes:
- More than 800 internal services instrumented with VALET data and SLO measurement within the programme
- SLO reviews established as a recurring developer workflow item across the engineering estate
- Error-budget enforcement culture scoped explicitly as a next-phase objective, not a current operational capability, in the published case study
Source: https://sre.google/workbook/slo-engineering-case-studies/
The Home Depot case carries particular weight because it was conducted with the maximum available support: direct involvement from the people who wrote the book. The outcome still scoped enforcement as aspirational. This is the correct sequencing, not a shortcoming. Measure first, trust the numbers, then enforce. The lesson for teams without CRE involvement is to adopt the same sequence with the same patience.
Company Name and Industry: Spotify, Music Streaming
Scale Context: Global streaming platform; case study covers the Spotify for Artists reliability team within a continuous delivery environment
Challenge: Making consistent, objective decisions about whether to invest in preventative reliability measures, in an environment where 55% of incidents required at least one responder to spend the better part of a working day on the response
Solution Implemented: Built a 1-to-5 incident-preventability rubric tied directly to error-budget consumption, providing an objective decision framework for reliability investment in place of engineering intuition or product pressure
Measurable Outcomes:
- Incident-preventability scoring applied consistently across all incidents in the relevant product area, replacing ad-hoc judgement as the decision mechanism
- Error-budget burn rate adopted as the objective criterion for preventative investment decisions: if the service remains within its SLO without a preventative measure, the measure is not taken
- Incident response burden quantified at baseline: 55% of incidents requiring major responder time, providing the first systematic measure for improvement tracking
Source: https://engineering.atspotify.com/2022/05/failing-forward-how-we-grow-from-incidents
Company Name and Industry: Monzo, Digital Banking and Financial Services
Scale Context: UK digital bank operating under FCA operational resilience requirements; primary platform of approximately 3,000 microservices serving several million UK customers
Challenge: Maintaining regulatory-grade reliability in a regulated environment while managing the operational complexity of a 3,000-microservice architecture, and tolerating potential full-cloud-provider outages without customer service interruption
Solution Implemented: Designed and built a parallel “Stand-in” platform of 18 microservices running continuously alongside the primary platform at approximately 1% of its operational cost; Stand-in handles core banking functions including card payments and account balance display and activates automatically when primary platform health degrades below defined thresholds
Measurable Outcomes:
- Stand-in platform maintained at approximately 1% of the operational cost of the 3,000-microservice primary platform
- First live activation during an August 2024 major cloud outage; the outage lasted approximately one hour, with full customer service continuity maintained throughout via Stand-in
- Architecture validated under production conditions during an unplanned real-world incident, confirming the design held at scale
Source: https://monzo.com/blog/tolerating-full-cloud-outages-with-monzo-stand-in
Monzo’s case is the clearest illustration in practice of the post’s central argument. The Stand-in architecture does not appear in the SRE handbook. It is the product of a team that understood what the handbook is trying to achieve and designed the mechanism that would achieve it under its specific constraints: a regulated financial services environment, a microservice architecture at exceptional scale, and FCA operational resilience obligations that are legally binding rather than internally aspirational.
The Business Case for Getting SRE Right
The cost of SLO theatre accumulates silently. A team that has instrumented SLOs without an enforcement policy has spent the organisational capital of getting SLO definitions agreed across engineering and product, the engineering time to build the measurement infrastructure, and the tooling cost. It has received none of the operational return: the postmortem-as-P0 loop does not run, the changes that would prevent the next incident are not prioritised, and the error budget does not govern the release calendar.
The quantifiable costs appear in toil and attrition data. At a median of 30% of team time spent on operational toil, a platform team of ten engineers at a fully-loaded mid-senior cost of £110,000 to £130,000 per year represents between £330,000 and £390,000 per year of team cost spent on work with no compounding return. Reducing toil by 10 percentage points through targeted automation frees between £110,000 and £130,000 per year of team capacity for engineering that compounds in future quarters. As explored in the FinOps evolution and strategic value guide, the most effective reliability investment arguments combine unit economics with delivery-health metrics to demonstrate compounding return, rather than framing reliability spending as pure cost avoidance.
The attrition cost of sustained on-call burnout is less often quantified and frequently larger. Catchpoint’s 2025 survey found nearly 70% of SREs citing on-call stress as a contributor to burnout and attrition. Replacing a senior platform engineer, accounting for recruitment, onboarding, and the institutional knowledge that leaves the organisation, typically costs a significant multiple of that engineer’s annual salary. A team that loses two senior engineers to on-call burnout over 18 months has incurred a reliability cost that no SLO dashboard captures and that will be misattributed to recruitment budget rather than to the on-call structure that caused it.
The business case for a real SRE programme, as distinct from SLO theatre, is not a cost reduction case alone. It is a delivery-health case: reduced incident frequency preserves developer throughput, reduced toil creates compounding engineering capacity, and stable team composition protects the institutional knowledge that makes both possible. The ROI compounds; the cost of inaction also compounds, in the direction of attrition and incident frequency.
A Decision Framework for Platform Teams
The question is not whether to implement SRE practice. For any team running production services with business-critical reliability requirements, the handbook practices represent the current state of the art. The question is how to sequence adoption to avoid the failure modes described in this post.
Reframe before restructuring. Creating an SRE job title or dedicated reliability function should be the last act, not the first. The first acts are establishing which services are business-critical, measuring current reliability from the user’s perspective for those services, and determining whether engineering and product share a definition of “working well.” Without those inputs, SLO definition is guesswork.
The threshold for a dedicated reliability function is approximately eight to ten engineers who can sustain a humane on-call rotation and a service estate complex enough that operational overhead is a measurable constraint on delivery velocity. Below that threshold, SRE practices absorb into the platform team and the overhead of a separate function exceeds the benefit.
The starting-point question should be answered by current delivery health. The four DORA metrics, deployment frequency, lead time for changes, change failure rate, and failed-deployment recovery time, can be instrumented from existing CI/CD and incident tooling without new investment. A team with change failure rate above 15%, or recovery times measured in days rather than hours, should address delivery instability before introducing SLOs. SLOs on an unstable delivery pipeline are SLO theatre by construction: the budget will burn before the team understands the cause.
The test for a working programme is not the presence of dashboards. It is whether an engineering leader can quote the current error-budget burn rate for the team’s most critical service without consulting a screen. If not, the programme has measurement without culture. Stop adding SLOs until the first one is being used as a decision input.
Implementation Roadmap
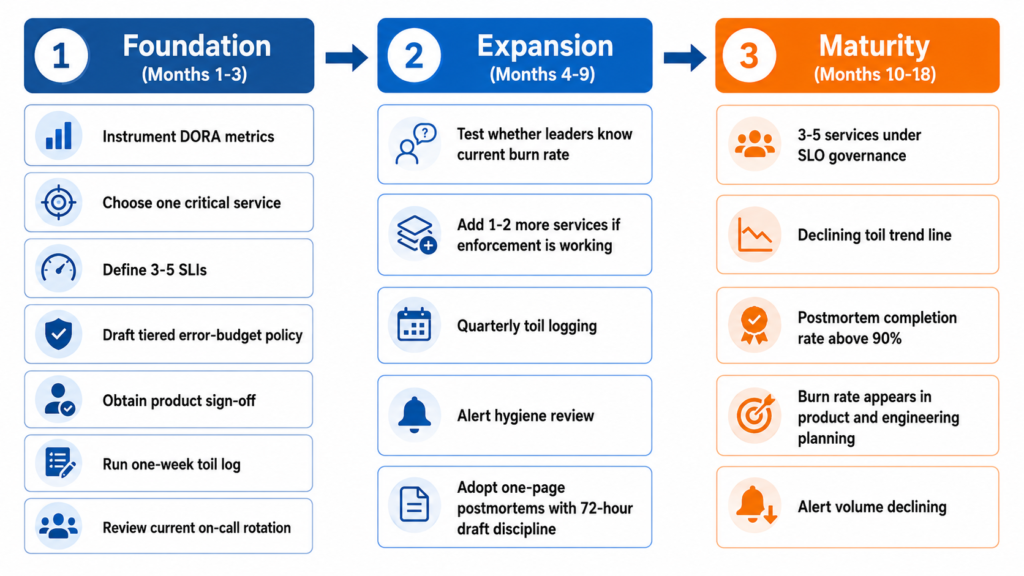
Phase 1: Foundation (Months 1-3)
Instrument the four DORA metrics from existing CI/CD tooling; no new tooling is required for teams using standard pipeline infrastructure. Identify one critical user-facing service where both engineering and product agree reliability has commercial consequence. Define three to five SLIs that measure that service from the user’s perspective rather than from inside the infrastructure. Set a rolling 30-day measurement window and draft the tiered error-budget policy. Obtain product sign-off on the policy. Then, and only then, publish the dashboard. Run a one-week toil log across the team to establish baseline. Conduct a retrospective on the current on-call rotation covering average actionable pages per shift, postmortem completion rate for P1 and P2 incidents in the preceding quarter, and which engineers are carrying a disproportionate share of the on-call burden.
Phase 2: Expansion (Months 4-9)
After 60 days on the first SLO, apply the test: can an engineering leader quote the current burn rate without a dashboard? If yes, the enforcement culture is forming and the team can add one or two additional services to the programme. If not, fix enforcement before extending SLO coverage. Run the one-week toil log on a quarterly cadence and track the trend. Begin alert hygiene work: for every alert that fired in the previous quarter, determine whether it was driven by a user-impacting symptom or an infrastructure metric and deprecate all instances of the latter. Introduce the one-page postmortem format and establish the 72-hour draft discipline as a team norm.
Phase 3: Maturity (Months 10-18)
A team with the right sequencing should reach this phase with three to five services under SLO governance, a declining toil trend line, and a postmortem completion rate above 90% for P1 and P2 incidents. The questions shift from measurement to culture: is the error-budget burn rate appearing in product and engineering planning conversations, or only in engineering retrospectives? Is on-call ownership clearly mapped to service ownership? Is alert volume declining? The DORA metrics tracked from month one provide the delivery-health baseline against which to evaluate whether the reliability programme is improving or degrading software delivery performance overall.
Platform Engineering, DORA, and What Comes After SRE
The SRE handbook was written before platform engineering existed as a named discipline. Gartner predicts that by 2026, 80% of large software engineering organisations will establish platform engineering teams for application delivery, up from 45% in 2022. That movement is in significant part the operational consequence of what happened when non-Google-scale teams tried to implement SRE and found they lacked the foundation. An internal developer platform, with self-service infrastructure, standardised CI/CD, pre-configured observability, and golden paths that embed reliability best practice into the default developer workflow, absorbs many of the functions the handbook assigns to dedicated SREs. It also means that the reliability gap is increasingly not a staffing question but a platform design question.
DORA provides the measurement framework most accessible to teams that cannot yet implement a full error-budget programme. The four keys, plus the reliability dimension added in 2021, can be instrumented from existing tooling and provide a delivery-health baseline that is both actionable and reproducible. The 2024 Accelerate State of DevOps Report forms part of DORA’s long-running research programme, which has heard from roughly 39,000 professionals globally, and remains the best-evidenced framework for understanding which practices reliably improve software delivery performance. For teams that cannot yet run honest error-budget negotiations with product, DORA is the on-ramp: measure delivery health first, layer SLOs on the services that matter most, then build enforcement culture over time.
The toil paradox will shape the near-term field. AI-assisted incident management and automated remediation are genuine capabilities that mature SRE teams are beginning to use effectively. The Catchpoint data showing rising toil despite AI adoption is a warning rather than a verdict: the pattern of AI supervision creating new categories of operational work is a property of immature implementations, not of the technology itself. Teams that instrument their toil baseline before deploying AI operations tooling will be able to evaluate the net effect with evidence. Teams that do not will be unable to determine whether the tooling is helping or adding overhead that was not there before.
As explored in the multi-region cloud architecture enterprise patterns guide, the reliability conversation at the architecture level increasingly intersects with resilience design: active-active deployment patterns, chaos engineering, and the deliberate design of systems to tolerate component failure. SRE practice tells you how to measure and respond to failure; resilience architecture tells you how to design systems that fail gracefully. Both are necessary, and the platform team that owns both problems is the one positioned to deliver the Monzo outcome: a reliability engineering solution designed for its own constraints, not copied from a handbook written for different ones.
Strategic Recommendations
Three recommendations follow from the evidence in this post.
Start with a practice, not a structure. The handbook’s own authors state explicitly that the SLO practice transfers without the SRE headcount structure. A platform team of 20 should adopt DORA measurement first, then one SLO with a signed enforcement policy, then a quarterly toil log, then a simplified postmortem format. The org chart stays unchanged until the practices are working and the service estate is too complex for a combined platform-and-reliability function to manage.
Treat SLO enforcement as a cultural achievement, not a tooling problem. The most common response when an SLO programme stalls is additional dashboard tooling. The actual bottleneck is almost always the absence of a signed, understood, and operationally enforced error-budget policy with genuine product commitment. Better tooling applied to an unenforced policy produces better-looking SLO theatre. The cultural investment is the product-engineering conversation that treats the burn rate as a decision input, and the only way to have that conversation is to have it repeatedly, starting from the first SLO.
Design for the team you have, not the team the handbook assumes. The Monzo Stand-in architecture, The Home Depot VALET tool, and the Spotify preventability rubric are all bespoke answers to bespoke constraints. None of them appears in the handbook. All of them are products of teams that understood what the handbook was trying to achieve and built the mechanism that would achieve it in their specific context. That is the implementation of SRE that actually works.
Useful Links
- Google SRE Book
- Google SRE Workbook
- Google SRE Workbook: SLO Engineering Case Studies (The Home Depot and Evernote)
- Google SRE Workbook: Error Budget Policy
- Google SRE Book: Eliminating Toil
- Catchpoint SRE Report 2025
- Spotify Engineering: Failing Forward
- Monzo: Tolerating Full Cloud Outages with Stand-in
- DORA: Accelerate State of DevOps Research
- Gartner Platform Engineering Research