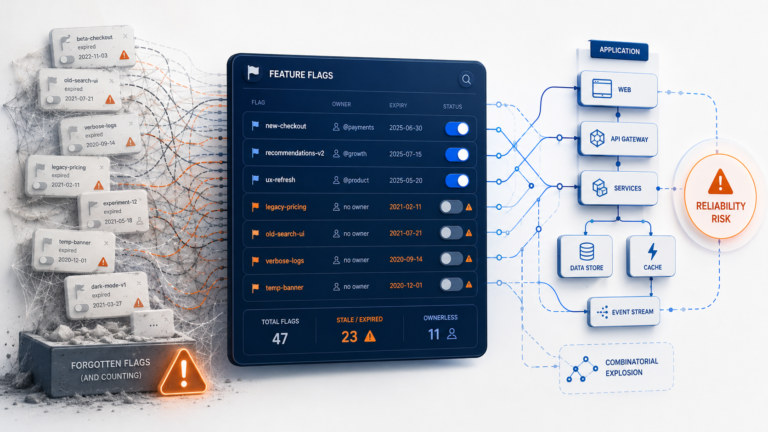
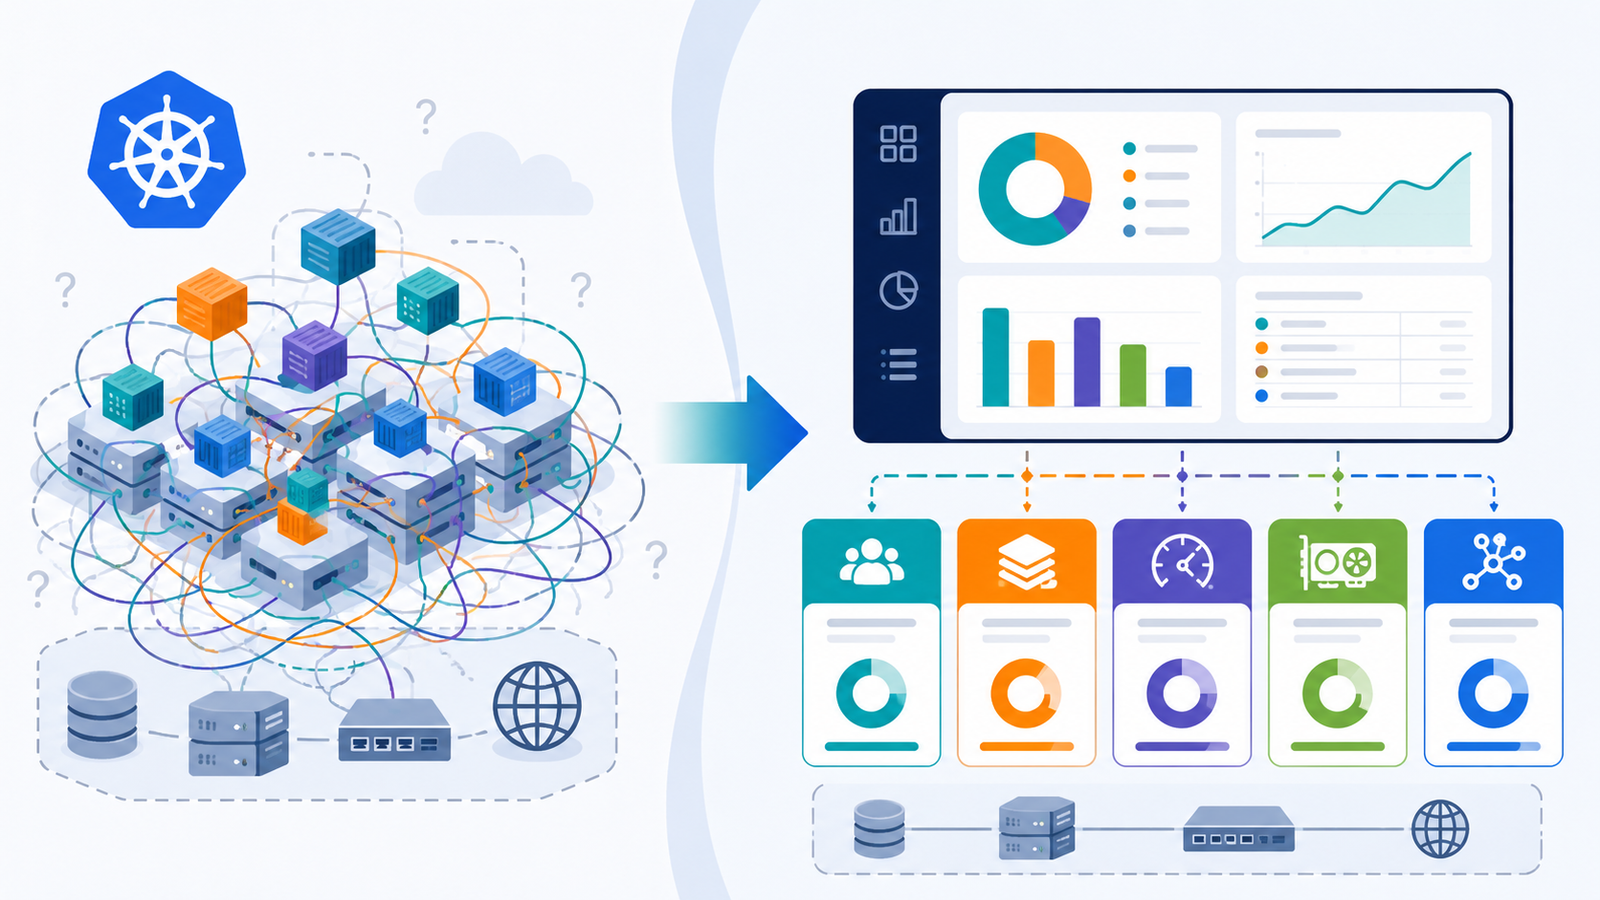
The FinOps Foundation’s State of FinOps 2025 report, drawn from organisations responsible for over $69 billion of cloud spend, found that only a small minority of organisations have reached “Run” maturity, with the majority still at “Walk” or “Crawl” stage. The rest are still building the fundamentals. For Kubernetes specifically, the picture is worse than most platform teams suspect: a CNCF and FinOps Foundation survey of 195 organisations found that 24% had no Kubernetes cost monitoring at all, 44% relied on monthly estimates, and only 13% were producing accurate showback reports. A more recent CNCF microsurvey puts active Kubernetes chargeback at around 2% of respondents. The practical consequence of this, according to Harness research covering 700 engineering and development leaders across the UK and US, is that 21% of enterprise cloud infrastructure spend (roughly $44.5 billion annually) is wasted on underutilised resources. Most of that waste is invisible because nobody has connected what runs in a cluster to what appears on a bill.
The instinct most organisations reach for when they finally decide to fix this is chargeback: build a system that bills each team for what it consumes and let financial accountability sort out the waste. The instinct is understandable and largely wrong. Hard chargeback applied before cost attribution is trusted produces a specific and predictable failure mode: month-end becomes a budget dispute, escalated to a VP before lunch, because the allocation methodology is opaque and the allocated costs include shared infrastructure the receiving team had no control over. Engineering time that should be spent on optimisation gets spent defending spreadsheets. The CNCF microsurvey data makes clear that the overwhelming majority of organisations that have tried to move directly to chargeback have not succeeded; the ones that have moved carefully through showback first are the ones with programmes that lasted.
The architecture that works is method-led, not tooling-led. The chargeback model you choose determines what the tooling needs to do, what data quality you need to have before money moves, and how much engineering time the programme will consume. Banco BV, one of Brazil’s largest private banks, built its cost accountability programme on GKE using BigQuery for usage extraction and Looker Studio for financial dashboards, and reported 30% savings in monthly billing. The architecture was not remarkable. The sequencing was: showback first, attribution validated against the actual bill, chargeback introduced only once the data was trusted. This post covers that sequencing in detail across AWS EKS, Azure AKS, and GCP GKE, from the allocation mechanics through to the tooling comparison and implementation roadmap.
Why Kubernetes Cost Allocation Is Hard
Kubernetes presents a specific billing problem that flat cloud billing does not. You are billed for nodes. You consume via pods. A cloud invoice tells you that an m5.4xlarge ran for 730 hours in us-east-1 and cost $560. It tells you nothing about which team’s workload occupied which fraction of that instance, or for how long, or whether the team over-provisioned their resource requests by a factor of eight.
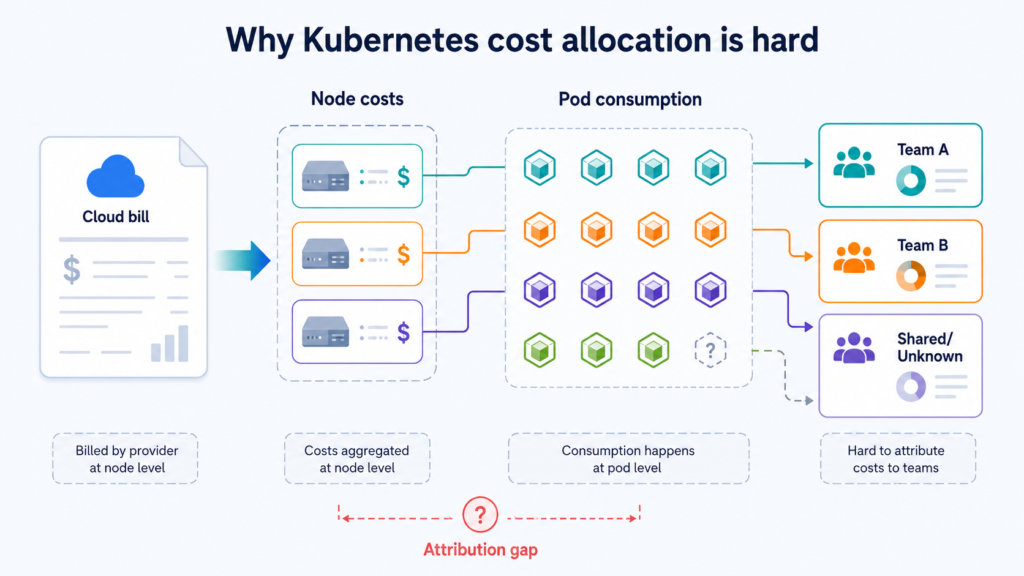
The gap between requested and actual resource consumption is where most of the waste lives, and it is large. Datadog’s cloud-cost research found that 83% of container costs were associated with idle resources, split between cluster idle and workload idle. Separately, Datadog’s container-usage research has shown widespread over-requesting, with many workloads using far less CPU and memory than requested. CAST AI’s latest analysis puts average Kubernetes CPU utilisation at 8% in 2025, down from 10% the prior year. When a team requests 4 vCPU for a pod that consistently uses 0.4, the scheduler cannot place anything else on that slice of the node. The capacity is held but idle, and under a naive allocation model, nobody is accountable for it.
The standard allocation model used by every major cost allocation engine, including OpenCost, Kubecost, AWS Split Cost Allocation Data (SCAD), the AKS Cost Analysis add-on, and GKE cost allocation, works as follows. Each node’s cost is divided by its allocatable CPU and memory. Each pod’s share is calculated as the time-weighted maximum of its resource request and its actual usage. A pod requesting 4 vCPU that uses 0.4 is allocated at 4 vCPU, not 0.4, because the scheduler had to hold that capacity. This model, sometimes described as max(request, usage), rewards teams that right-size their requests and makes over-provisioning immediately visible in the attribution data.
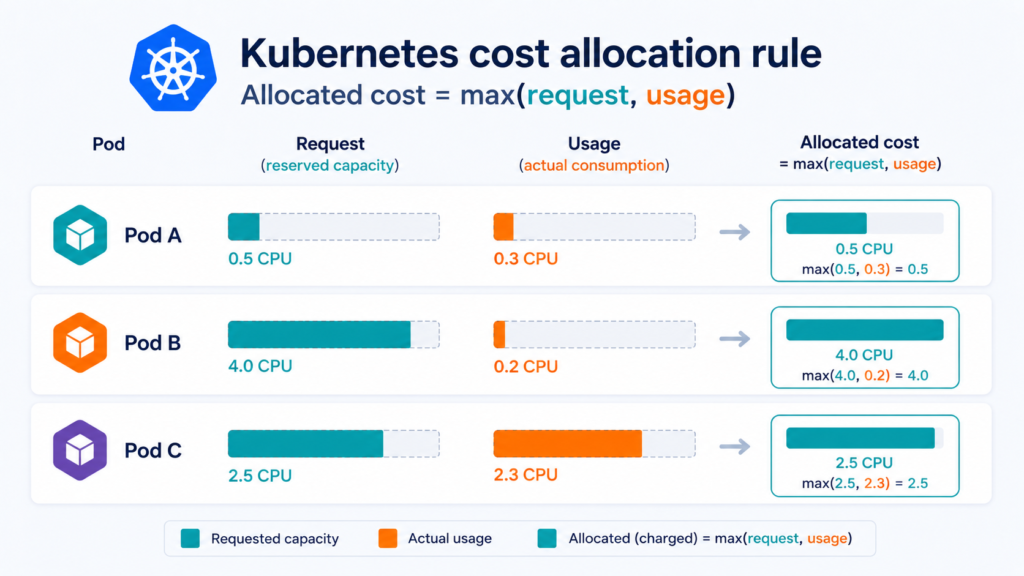
That leaves the question of what to do with idle capacity: the node resources nobody requested. There are two defensible approaches. The first holds idle costs in a central platform engineering budget, on the grounds that idle capacity is partly a function of bin-packing efficiency and cluster topology decisions that application teams cannot control. The second distributes idle proportionally across consuming teams, on the grounds that the platform is provisioned to serve those workloads and the costs belong to the consumers. Neither approach is universally correct. What matters is that the policy is documented, agreed, and applied consistently before any financial allocation is made. Introducing chargeback and then changing the idle cost policy mid-cycle is the fastest way to lose engineering trust in the programme.
Shared services create a second allocation problem. Ingress controllers, DNS, monitoring stacks, the control plane itself on EKS ($0.10 per cluster per hour), and cluster-level tooling like cert-manager serve all tenants but are not attributable to any individual workload. The standard pattern is to hold these in a shared platform namespace and either distribute them proportionally across consuming teams or keep them in a central platform budget. Kubecost handles this with shareNamespaces and shareLabels parameters that redistribute named namespaces’ costs across all other allocations. OpenCost exposes the same data, with aggregation handled in whichever reporting layer you build on top. The principle is the same across all three clouds: agree the policy upfront and encode it in the allocation tool’s configuration before the first showback report goes out.
Network egress attribution is where every allocation engine approximates rather than measures. Cross-AZ traffic on EKS and inbound/outbound data through NAT gateways are real costs that do not map cleanly to pod-level billing. GKE cost allocation optionally tracks network egress, and Kubecost attributes network costs per allocation, but the precision of both is limited by the granularity of the underlying network flow data. For teams running services with significant inter-zone data movement, topology-aware routing and per-AZ NAT gateways are the mitigations that reduce the cost; the allocation tool surfaces the problem but cannot solve it.
GPU cost allocation has become unavoidable for platform teams supporting AI workloads. The NVIDIA device plugin’s default behaviour assigns whole GPUs: a pod requesting nvidia.com/gpu: 1 holds an entire A100 regardless of utilisation, blocking the card from other tenants. Multi-Instance GPU (MIG) partitioning splits A100 and H100 cards into up to seven isolated instances with their own memory and compute allocation. AWS SCAD attributes accelerator costs at the pod level on EKS. For any platform team supporting AI workloads, billing at the MIG-instance slice level is where the meaningful chargeback accuracy gains now come from.
The Three Models and What Each One Actually Requires
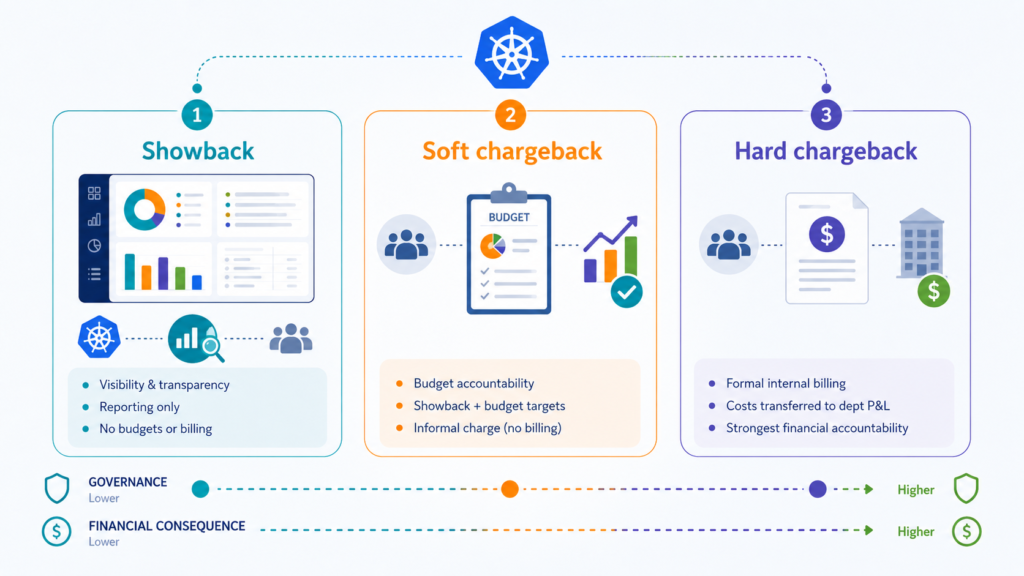
The framing of showback, soft chargeback, and hard chargeback as a maturity ladder is widespread and misleading. The FinOps Foundation is explicit that these are not sequential stages you pass through on the way to sophistication: they are distinct models suited to different organisational contexts. Choosing hard chargeback because it sounds more mature than showback, without the data quality and engineering team control that make it defensible, is how chargeback programmes get cancelled.
Showback reports costs to teams without financial consequence. Central IT or the platform team pays the cloud bill; each application team receives a report showing what their workloads cost. The architecture requirement is modest: cost data must be attributable to teams via namespace or label, and reports must be accurate enough that teams trust them. The primary value of showback is behavioural change through visibility, and it doubles as a data quality proving ground. If the showback report shows 40% of spend as “unallocated” because a third of workloads lack cost-allocation labels, that is a signal the data is not ready for chargeback, not a reason to introduce chargeback anyway. Showback suits any maturity level, and the FinOps Foundation’s position is that a well-run showback programme is sufficient justification for the FinOps investment, without ever progressing further.
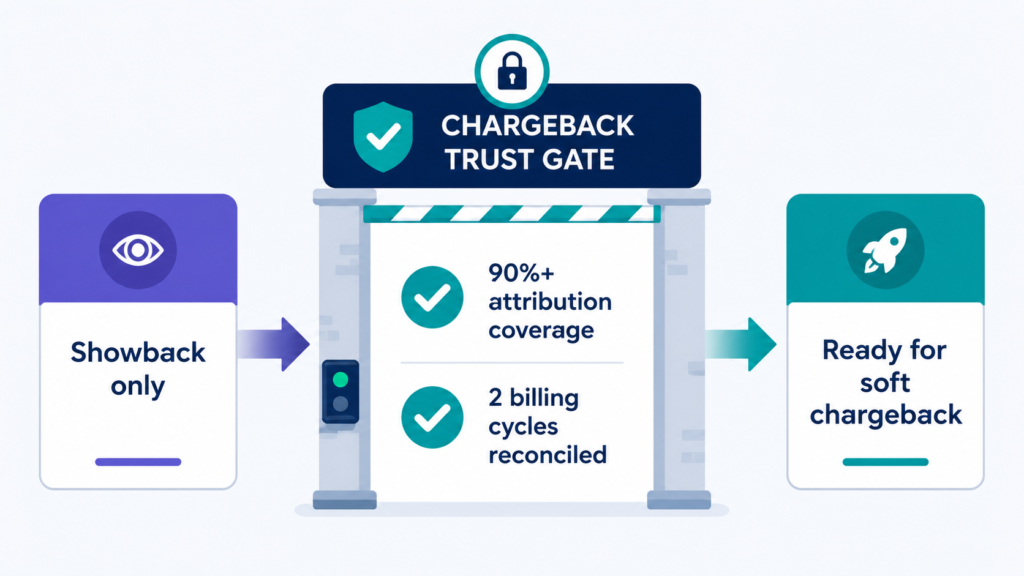
Soft chargeback allocates costs to team or department budgets for accountability purposes without a hard, irreversible transfer to a department’s P&L. In practice this typically means a “budget-vs-actual” mechanism, internal credits, or notional cost centre adjustments that create accountability without triggering procurement processes or requiring finance system integration. It requires the same attribution pipeline as showback, plus documented and agreed shared-cost and idle-cost policies that teams have reviewed and accepted. The failure mode is attributing costs teams cannot control: if a team is billed for idle capacity driven by a cluster topology decision made by the platform team, the soft chargeback number becomes a grievance rather than an incentive. The prerequisite before introducing soft chargeback is that attribution coverage is at or above 90% and that allocation data has been validated against the actual cloud bill for at least two billing cycles.
Hard chargeback formally transfers costs to each department’s P&L, creating an internal billing relationship with the same financial weight as any other vendor invoice. If a product team consumes $20,000 of Kubernetes resources in a month, $20,000 comes off that team’s operating budget. This model requires defensible attribution accuracy, integration with financial systems (typically via an ERP connection or a formal internal billing process), and a finance partner who has reviewed and signed off on the allocation methodology. Where it destroys engineering productivity is precisely when those prerequisites are not in place: inaccurate allocations become finance disputes that consume disproportionate engineering and management time, and teams begin optimising to game the allocation methodology rather than to reduce actual resource consumption. The legitimate reasons to run hard chargeback are a genuine compliance or audit requirement, a need for accurate departmental P&L for external reporting, or a unit-economics programme where each product line’s true infrastructure cost needs to be visible in financial reporting. These are real requirements; they are just not the reasons most teams introduce hard chargeback in practice.
The transition between models should be gated by two hard thresholds: attribution coverage above 90% (meaning less than 10% of spend landing in “unallocated” or “unknown” buckets), and at least two months of allocation data validated against the actual cloud bill. Missing either threshold and proceeding anyway is the source of most chargeback programme failures. The broader FinOps maturity principles that inform this sequencing are covered in FinOps Demystified: Mastering Cloud Costs.
Tagging Taxonomy: The Foundation Everything Depends On
Cost attribution in Kubernetes is a label problem before it is a tooling problem. A team can deploy the most sophisticated cost allocation engine available and still produce reports with 40% of spend in an “unallocated” bucket if the workloads running in the cluster lack the labels the allocation engine uses to group costs by owner.
The label taxonomy that works in production combines the Kubernetes recommended labels with a small set of organisational labels using a company-specific domain prefix to prevent collisions with system labels. The Kubernetes recommended labels cover app.kubernetes.io/name, app.kubernetes.io/instance, app.kubernetes.io/component, app.kubernetes.io/part-of, and app.kubernetes.io/managed-by. The organisational labels that matter for cost attribution are team, environment, cost-centre, product, and owner. Label keys must be 63 characters or fewer (with a prefix of up to 253 characters), and the kubernetes.io/ and k8s.io/ prefixes are reserved for system use.
The enforcement mechanism matters more than the taxonomy itself. A label taxonomy documented in a wiki page and applied inconsistently by developers produces the unallocated-bucket problem. The pattern that works is policy-as-code: OPA Gatekeeper or Kyverno admission webhooks reject any workload that arrives in the cluster without the required labels, and CI pipeline checks fail pull requests that are missing label definitions before they reach the cluster. This converts labelling from an optional best practice to a hard gate in the deployment process. The FinOps Foundation’s current guidance is explicit that tag policies should be enforced at the infrastructure layer rather than applied retroactively, because retroactive cleanup at scale is an engineering project that rarely reaches completion.
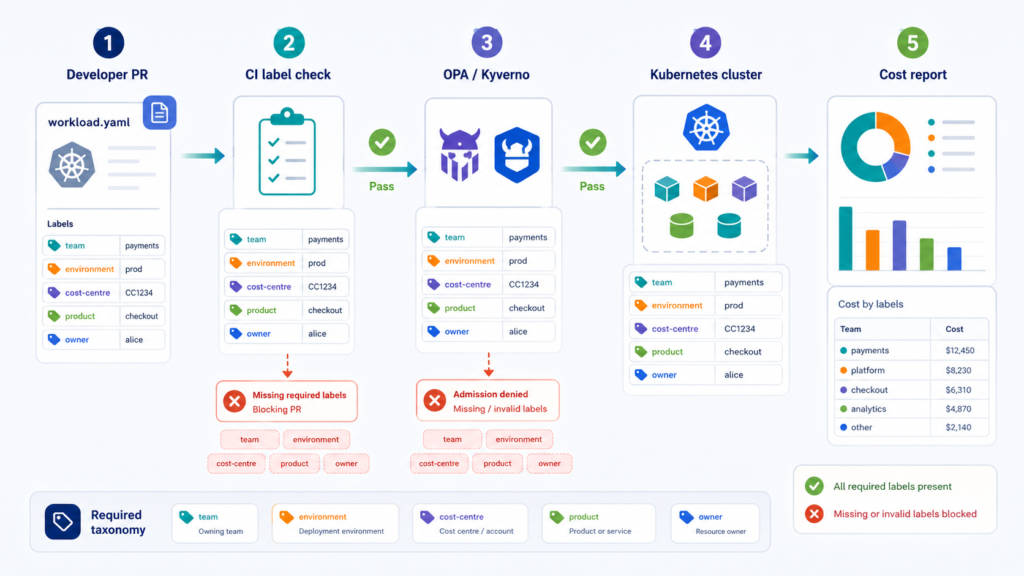
How labels propagate to billing differs meaningfully across the three clouds. On AWS, Kubernetes labels are imported into the Cost and Usage Report as cost allocation tags via SCAD, alongside auto-generated tags including aws:eks:cluster-name, aws:eks:namespace, aws:eks:deployment, aws:eks:workload-name, aws:eks:workload-type, and aws:eks:node. These must be activated in the AWS Billing console before they appear in CUR, and CUR line item volume increases with each pod tracked, roughly two new usage records per pod per hour. On Azure, the AKS Cost Analysis add-on reconciles cluster data with the Azure invoice and surfaces namespace and workload views in Microsoft Cost Management, requiring Standard or Premium tier and an Enterprise Agreement or Microsoft Customer Agreement. On GCP, GKE cost allocation maps pod and namespace label usage to Cloud Billing line items, viewable in the billing console and the BigQuery export, but only pod and PVC labels are tracked and data is not backfilled to before the feature was enabled.
The coverage metric to track is simple: what percentage of cluster spend can be attributed to a named team or cost centre? The benchmark for soft chargeback is 90%. Below that, the unallocated portion creates enough ambiguity to undermine confidence in the programme.
Tooling: Native Versus OpenCost Versus Kubecost
The tooling landscape for Kubernetes cost allocation has converged significantly. OpenCost, donated to the CNCF by Kubecost and now an incubating project, is the allocation engine that underpins both Kubecost and the AKS Cost Analysis add-on. The native tools on all three clouds use the same max(request, usage) allocation logic. The differentiation between tools now sits in reconciliation accuracy, multi-cluster aggregation, RBAC and governance, and long-term retention, not in how per-pod costs are calculated.
| Feature | OpenCost (open source) | Kubecost Enterprise | AWS SCAD + Cost Explorer | AKS Cost Analysis add-on | GKE cost allocation |
|---|---|---|---|---|---|
| Licence cost | Free | Not generally published; see AWS Marketplace for current offers | No licence fee | No licence fee | No licence fee |
| Bill reconciliation | No | Yes (spot, RIs, savings plans, EDP) | Yes (to AWS bill) | Yes (to Azure invoice) | Via BigQuery export |
| Multi-cluster view | DIY aggregation | Native federated view | All EKS clusters in billing family | Per-subscription scope | Via BigQuery |
| Retention | Prometheus default (~15 days) | Unlimited | Per CUR storage | Per Log Analytics workspace | Per BigQuery dataset |
| RBAC | Basic | SAML/SSO, enterprise RBAC | IAM-based | Azure RBAC | IAM-based |
| GPU/accelerator allocation | Basic | Yes | Yes (SCAD) | Not documented in official Microsoft Learn AKS Cost Analysis pages | Yes — GPU and TPU SKUs supported, with documented exceptions |
| Idle cost surfacing | Yes | Yes | Partial (used capacity only) | Yes (explicit idle line items) | Via usage metrics |
| Out-of-cluster costs | No | Yes | Via Cost Explorer | Via Cost Management | Via Billing export |
| Engineering overhead | High (DIY stack) | Low | Low | Low | Low |
OpenCost is the right starting point for a team that already runs Prometheus and Grafana and wants a vendor-neutral allocation baseline. It deploys as a Prometheus exporter, reads cluster metrics, and exposes cost metrics back to Prometheus for Grafana dashboards and AlertManager alerts. The opencost-mixin provides ready-made dashboards and alerts, including a threshold alert that fires when a three-hour average cost exceeds the seven-day average by more than 20%. The honest accounting of its total cost of ownership includes the Prometheus stack, long-term storage (Thanos or Mimir for anything beyond the default 15-day retention), and the engineering time to build and maintain aggregation across more than one cluster. For a team managing 20 or more clusters, that aggregation burden is a real, recurring engineering cost that grows with cluster count.
Kubecost Enterprise removes the aggregation and retention burden via its federated multi-cluster view and unlimited retention, adds bill reconciliation that accounts for spot pricing, Reserved Instances, Savings Plans, and Enterprise Discount Programme rates, and provides the governance layer (budgets, anomaly detection, SAML/SSO, enterprise RBAC) that hard chargeback programmes require. Enterprise pricing is not generally published and should be validated directly with IBM or through marketplace channels; the current AWS Marketplace public listing shows a 12-month IBM Kubecost Enterprise offer at $15,000, with other packaging options available by private offer. For larger estates, the evaluation should focus less on a single public anchor price and more on whether multi-cluster federation, bill reconciliation, governance, and retention remove enough engineering overhead to justify the commercial cost. The free tier is capped at 250 cores and 15-day retention, which covers proof-of-concept work but not production at any meaningful scale.
AWS Split Cost Allocation Data is the native EKS option and integrates directly with Cost and Usage Report and Cost Explorer. It allocates CPU, memory, and accelerator costs at the pod level using max(request, usage), attributes costs by cluster, namespace, deployment, workload type, and node, and adds no licensing cost beyond the incremental S3 storage for the additional CUR line items. The important nuance is that SCAD adds pod-level split cost and unused-cost records to the CUR rather than replacing the existing EC2 line items; teams should reconcile pod-level rows through CUR and Cost Explorer rather than treating them as a like-for-like replacement for the raw EC2 bill.
AKS Cost Analysis is the Azure native option, now generally available as a cluster add-on built on OpenCost. It requires Standard or Premium tier, supports clusters up to approximately 7,000 containers, and surfaces idle, system, service, and unallocated charges as explicit separate line items, which is a meaningful reporting improvement over tools that lump these together. It reconciles against the Azure invoice via Microsoft Cost Management. Virtual nodes (ACI) are not supported, and multi-cluster visibility is scoped to the subscription boundary. For organisations on Azure with a single-cloud Kubernetes estate, AKS Cost Analysis is the lowest-friction starting point.
GKE cost allocation is the recommended GCP native option (superseding the older GKE usage metering). It is free to enable, maps pod and namespace cost data to Cloud Billing line items, and integrates naturally with the BigQuery billing export. The reporting stack most organisations build on this is BigQuery plus Looker Studio or Grafana; the BigQuery export supports the kind of custom queries that product-level unit economics reporting requires. Multi-cluster aggregation across a GCP organisation is achievable through BigQuery because all projects’ billing exports can land in the same dataset.
Real-World Case Studies
Company Name and Industry: Banco BV, Financial Services (Brazil)
Scale Context: One of Brazil’s 15 largest private banks by assets; FinOps programme covering GKE workloads alongside Cloud SQL and Compute Engine estate.
Challenge: No consolidated cost attribution across cloud services; cloud spend growing without visibility into which business units or products were driving it; no mechanism to hold engineering teams accountable for infrastructure decisions.
Solution Implemented: Dedicated FinOps department established in 2021. GKE cost data extracted via BigQuery using GKE cost allocation. Looker Studio dashboards built for financial accountability reporting. Cloud Scheduler and Recommender integrated for automated resource turndown and rightsizing. Chargeback process implemented with BigQuery as the attribution source of truth.
Measurable Outcomes:
- 30% reduction in monthly cloud billing reported across the programme (note: this figure is attributed to the combination of reservation optimisation on Cloud SQL and Compute Engine and the FinOps programme overall; the GKE chargeback contribution is described qualitatively, not separately quantified)
- Cost attribution to business units and products enabled for the first time
Source: https://cloud.google.com/customers/banco-bv
Company Name and Industry: Securonix, Cybersecurity SaaS
Scale Context: 40 EKS clusters; 5,000 to 6,000 EC2 instances; 10,000+ concurrent Apache Spark jobs running on Kubernetes.
Challenge: Highly multi-tenant environment across 40 clusters with no consistent cost attribution by tenant; inability to understand per-customer infrastructure cost; scaling costs growing faster than revenue.
Solution Implemented: EKS as the Kubernetes platform across all clusters; Spot Instances for Spark workloads with Spot interruption handling; cost allocation implemented at the namespace and workload level across the cluster estate. AWS Cost Explorer used for consolidated billing visibility.
Measurable Outcomes:
- Approximately 30% reduction in infrastructure costs
- Cross-cluster deployment time reduced from 3 to 4 hours to 15 minutes
- Multi-tenant cost attribution achieved across the full 40-cluster estate
Source: https://aws.amazon.com/solutions/case-studies/securonix-case-study
Cost Analysis and ROI
The cost question for a chargeback programme has two components that are often conflated: the cost of the tooling, and the cost of the engineering time to operate it. Tooling that appears free is not free if it requires two senior engineers to maintain the aggregation, storage, and reporting layer.
For a team managing up to five clusters on a single cloud, the native tools are the right starting point. AWS SCAD, AKS Cost Analysis, and GKE cost allocation all carry no licence cost and reconcile to the actual cloud bill, which is the property that matters most for soft or hard chargeback. The incremental infrastructure cost is small: additional S3 storage for SCAD-enriched CUR line items on AWS; Standard or Premium tier on AKS (which many production clusters are already on); BigQuery query costs on GCP that are typically negligible.
OpenCost with Prometheus and Grafana is a viable architecture for teams with platform engineering capacity and a preference for vendor neutrality. The operational cost is real but quantifiable: Prometheus storage (with Thanos or Mimir for retention beyond 15 days), dashboard maintenance, and the aggregation work that scales with cluster count. For a team managing 20 clusters, this is a meaningful but manageable investment if the capability already exists.
Kubecost Enterprise becomes the correct evaluation when the cluster estate reaches a scale where the multi-cluster aggregation and bill reconciliation value outweighs the licence cost. Enterprise pricing is not generally published; the AWS Marketplace currently shows a 12-month public offer at $15,000, with most enterprise packaging handled by private offer. The correct evaluation frame is not a single price anchor but whether the federation, reconciliation, and governance capabilities remove enough engineering overhead at your scale to justify the commercial cost. The ROI calculation is clear if the tooling surfaces waste that is then acted on: given that Datadog’s cloud-cost research found 83% of container costs associated with idle resources, a six-figure tooling investment at a $5 million annual Kubernetes spend pays back quickly if it drives rightsizing. The tooling does not rightsize automatically; it identifies the waste. The ROI lives in the organisational response, not the dashboard.
The FinOps Foundation’s own position on chargeback is relevant here: the programme’s value is measured in waste eliminated and accountability created, not in the sophistication of the billing model. The path to consistent ROI is showback adopted quickly with native tooling, cost-awareness baked into engineering team workflows via Grafana or existing observability tooling, and model escalation gated by the hard attribution-coverage thresholds rather than by a timeline.
For unit economics (cost per customer, per request, or per transaction), the architecture extends beyond Kubernetes allocation into application instrumentation: request counts, customer identifiers, and product identifiers need to flow into the same data store as the cost allocation data. BigQuery on GCP and Athena on AWS are the standard choices for this join. The Kubernetes allocation layer provides the cost side; the application metrics provide the denominator. This is the architecture Banco BV built, and it represents the mature end of what a chargeback programme can enable.
Decision Framework
The decision between models should be made by answering three questions in sequence before any tooling is selected.
First: what is the attribution coverage today? If the answer is unknown, the starting point is a label audit: enable native cloud cost attribution tools and run a showback report. The percentage of spend in “unallocated” buckets is the baseline. If unallocated spend is above 10%, the programme is in showback mode regardless of intent, because the data quality does not support anything else.
Second: do the teams receiving allocated costs have meaningful control over those costs? Teams need autoscaling configured, rightsizing tooling available, and the ability to respond to the costs attributed to them. Charging teams for idle capacity caused by a cluster topology decision made by the platform team, or for shared services they have no influence over, produces resentment and accountability theatre rather than optimisation. Before introducing soft chargeback, verify that each team has the levers to respond to its allocated costs.
Third: is there a genuine compliance, audit, or P&L requirement for hard chargeback? Regulated industries (financial services, healthcare), external cost reporting, or product unit-economics programmes may have a legitimate requirement for formal billing. These are valid reasons to build the full hard chargeback architecture. Adopting hard chargeback without this requirement, because it sounds more mature, is a risk to the programme.
For platform teams building on AWS, the AWS Control Tower and multi-account governance patterns post covers the account boundary decisions that affect which cost attribution options are available and how SCAD data aggregates across a consolidated billing family. For Azure, AKS Cost Analysis requires Standard or Premium tier, so the cost tier decision discussed in Azure Kubernetes Service: Production-Grade Enterprise Implementation is a prerequisite for the native attribution option.
The tooling decision follows from the model choice. Showback on native tools is always the starting point. OpenCost is the right addition when vendor neutrality matters and platform engineering capacity exists to operate it. Kubecost Enterprise is the right choice when multi-cluster federation, bill reconciliation accuracy, and enterprise governance are required and the organisation is prepared to pay the licence cost at scale.
Implementation Roadmap
Phase 1: Foundation (Months 1-3)
The first ninety days are about data quality, not cost allocation. The output of this phase is a trusted showback report with less than 10% unallocated spend, not a chargeback model.
Start by enabling the native cost attribution tool for your primary cloud: SCAD on EKS (activating cost allocation tags in the Billing console and enabling SCAD in Cost Explorer), the AKS Cost Analysis add-on on each cluster, or GKE cost allocation via the BigQuery billing export. Run the first showback report within two weeks. Do not wait until the label taxonomy is perfect; the report showing 40% unallocated spend is the diagnostic that makes the taxonomy conversation urgent.
Establish the label taxonomy and enforcement simultaneously. Adopt app.kubernetes.io/* labels plus team, environment, cost-centre, product, and owner. Deploy OPA Gatekeeper or Kyverno admission webhooks to reject unlabelled workloads, and add label validation to CI pipelines. Set a 90-day target for attribution coverage above 90%.
Document the idle cost policy and the shared-service policy before the first report reaches a team. These policies need to be agreed, not announced. The allocation methodology document that accompanies the first showback report is the artefact that prevents month-end disputes later.
Common failure patterns in the first 90 days: treating label remediation as a one-sprint task (it is not), building dashboards before the data is trusted (nobody reads them), and conflating the showback programme with chargeback in internal communications (teams that think they are being billed will game the labels rather than use them for attribution).
Phase 2: Expansion (Months 4-9)
Once attribution coverage is stable above 90% and two billing cycles of showback data have been validated against the actual cloud bill, the programme can move to soft chargeback with confidence.
Integrate cost reporting into existing engineering workflows. Cost data surfaced in Grafana alongside latency and error-rate metrics produces behaviour change; cost reports sent by email monthly do not. The integration pattern with OpenCost and Prometheus is direct: OpenCost exports cost metrics to Prometheus, which Grafana queries alongside operational metrics. Teams see cost trends in the same dashboard they already consult during incident response and sprint retrospectives.
Introduce anomaly alerting at this stage. The OpenCost Prometheus mixin includes an alert that fires when the three-hour cost average for a namespace exceeds the seven-day average by 20%; this is a useful default threshold. Tune it per team based on the deployment cadence and workload pattern.
For teams managing significant Spot Instance or preemptible workloads, the patterns covered in Spot Instance Architecture: Designing Fault-Tolerant Workloads for 60-91% Compute Savings are the optimisation layer that makes the chargeback numbers shrink. Soft chargeback makes cost visible; right-sizing and Spot adoption are how teams respond to that visibility.
If the cluster estate spans more than five clusters or multiple clouds, evaluate Kubecost Enterprise or a third-party FinOps platform in this phase. The evaluation criteria are: does the federated view provide enough additional insight to justify the licence cost over native tooling plus OpenCost? For most estates below 15 clusters on a single cloud, the answer is no. Above 30 clusters or across multiple clouds, the aggregation cost of the DIY stack typically exceeds the Kubecost Enterprise licence.
Phase 3: Maturity (Months 10-18)
Mature programmes are characterised by cost data that engineering teams act on without prompting, attribution that finance teams trust for departmental P&L, and unit economics that product teams use for pricing decisions.
Unit economics is the most valuable capability in this phase. It requires the Kubernetes cost attribution layer to join with application-level metrics (request count, customer identifier, transaction type) in a shared data store: typically a BigQuery or Athena table combining billing export with application telemetry, queried by a Grafana or Looker Studio dashboard showing cost per request alongside reliability metrics. Industry research consistently finds that unit-level cloud cost tracking remains the exception rather than the norm; the organisations that do it have a measurable pricing and investment-decision advantage over those that do not.
GPU cost governance becomes critical for platform teams supporting AI workloads. Instrument MIG partitioning on A100 and H100 nodes, bill at the MIG-instance slice level, and track GPU idle separately from active use: reserved-but-idle GPU capacity is typically the largest single waste line in AI-supporting Kubernetes environments. The broader context of how FinOps practices mature from cost visibility to strategic value is covered in the FinOps Evolution: From Penny-Pinching to Profit Engine post.
Strategic Recommendations
Start with showback, every time. The instinct to move directly to chargeback because the organisation has decided cloud costs need accountability is almost always wrong about the sequence, even when it is right about the goal. Six months of showback with attribution coverage above 90% produces more lasting cost reduction than six months of hard chargeback with 60% attribution coverage, because the first creates trusted data that engineering teams act on, and the second creates disputes that consume the time engineering teams would otherwise spend optimising.
For the tooling choice: native tools first, OpenCost for vendor neutrality, Kubecost Enterprise when multi-cluster federation and reconciliation accuracy justify the licence at your scale. Do not buy Kubecost Enterprise to solve a labelling problem. The labelling problem is solved by OPA Gatekeeper and CI enforcement, not by a more sophisticated allocation engine.
The most common failure in platform team chargeback programmes is attribution of costs that teams cannot control. If a team is billed for idle capacity, for shared services, or for control-plane costs that are a function of cluster topology decisions the platform team made, the chargeback number becomes a grievance. Hold what teams cannot control in a platform budget. Bill teams only for what their workloads consume and can optimise.
The signal that the programme is working is not the sophistication of the billing model: it is engineering teams requesting cost dashboards in their sprint tooling, raising rightsizing PRs before month-end reports, and making architecture decisions with cost as a first-class input alongside performance and reliability. That behaviour change is what the chargeback architecture is for.