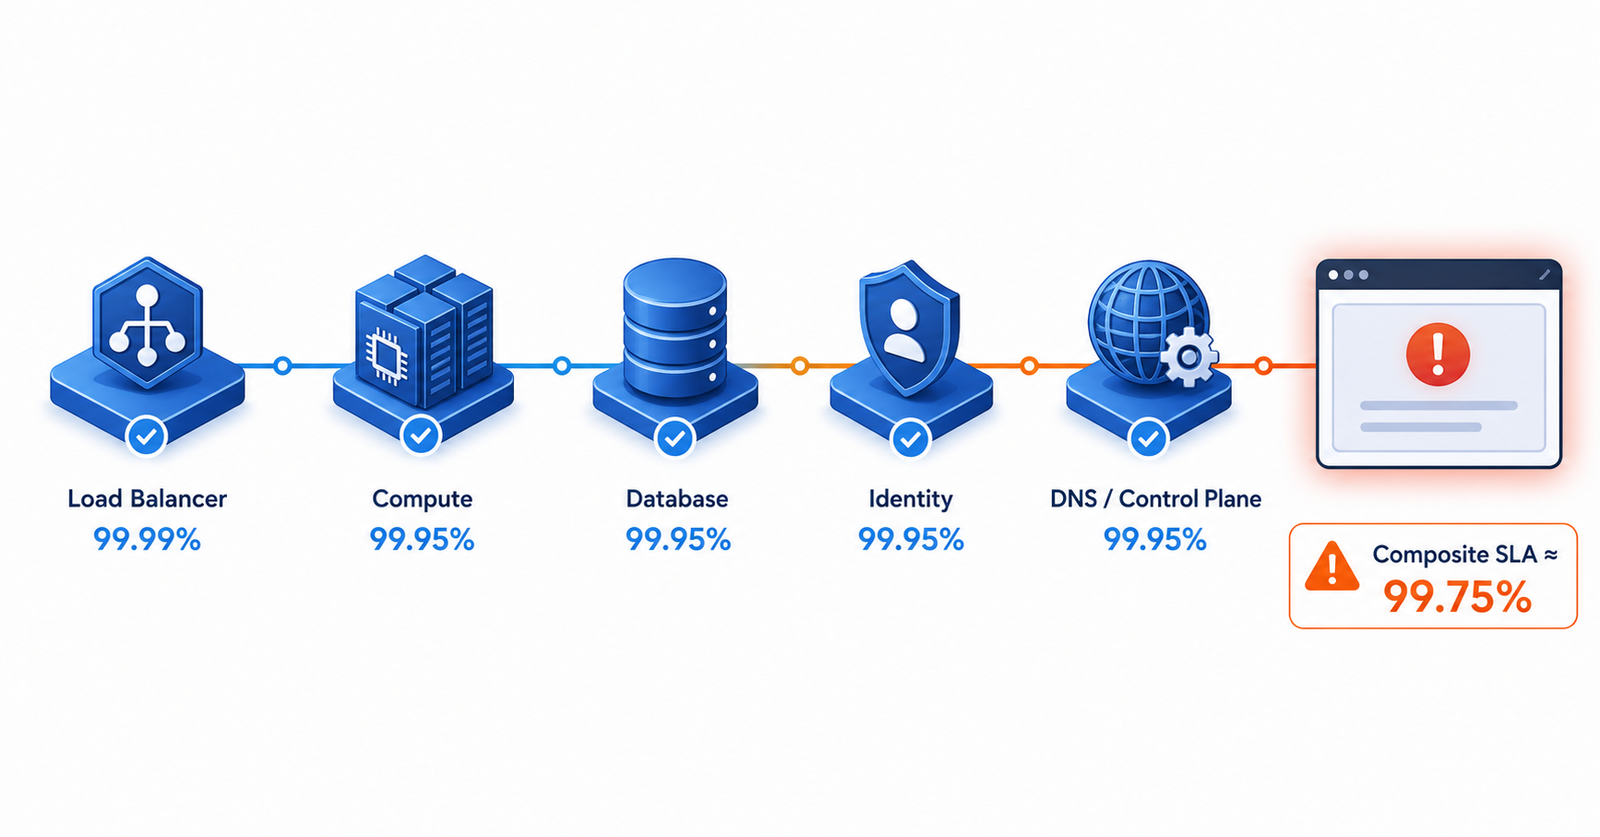
Every architecture review reaches the point where someone quotes an SLA. Compute runs at 99.99%. The managed database promises 99.95%. The load balancer sits at 99.99% too. Nobody in the room calculates the composite SLA those three figures multiply down to, and if they did, the number that came out would sit below every single one just quoted. Five typical services each running at 99.95% compose to roughly 99.75% composite availability, which works out closer to a full day of allowed downtime a year than the four and a half hours any one of those services promises on its own. That composite figure is the one your users actually experience. It appears on no vendor pricing page, no procurement contract, and no architecture diagram. It only gets calculated after an incident, by someone trying to explain to a director why “everything was within SLA” and the service was still down for six hours.
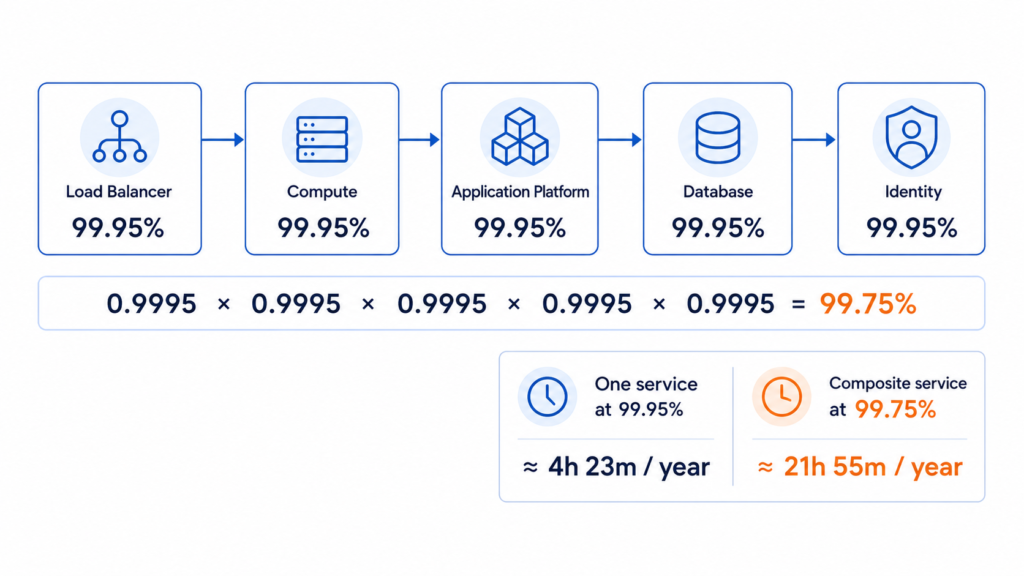
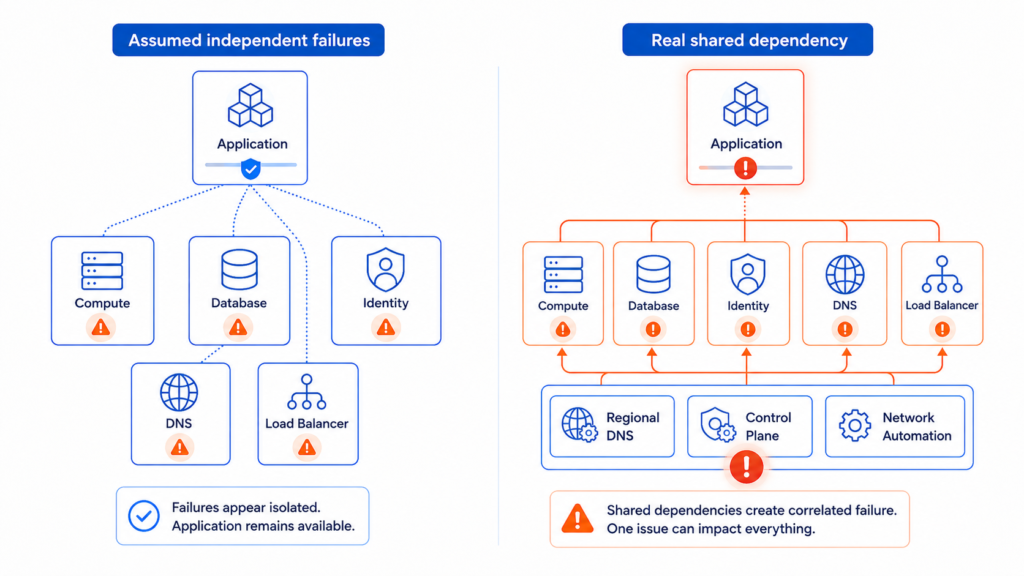
The multiplication itself is uncontroversial. Microsoft’s own Architecture Center walks through the example: an App Service running at 99.95% combined with a SQL Database at 99.99% composes to 99.94%, a figure lower than either input, published by the vendor selling both components. It is the kind of arithmetic the reliability pillar in our guide to the AWS Well-Architected Framework treats as a foundation rather than an afterthought. What is less widely appreciated is that this multiplied number is optimistic. Microsoft’s reliability documentation now explicitly warns engineers against relying on it, because the calculation assumes every dependency fails independently, which rarely happens, and it ignores the specific exclusions written into each underlying SLA. Correlated failure is the part the maths cannot see.
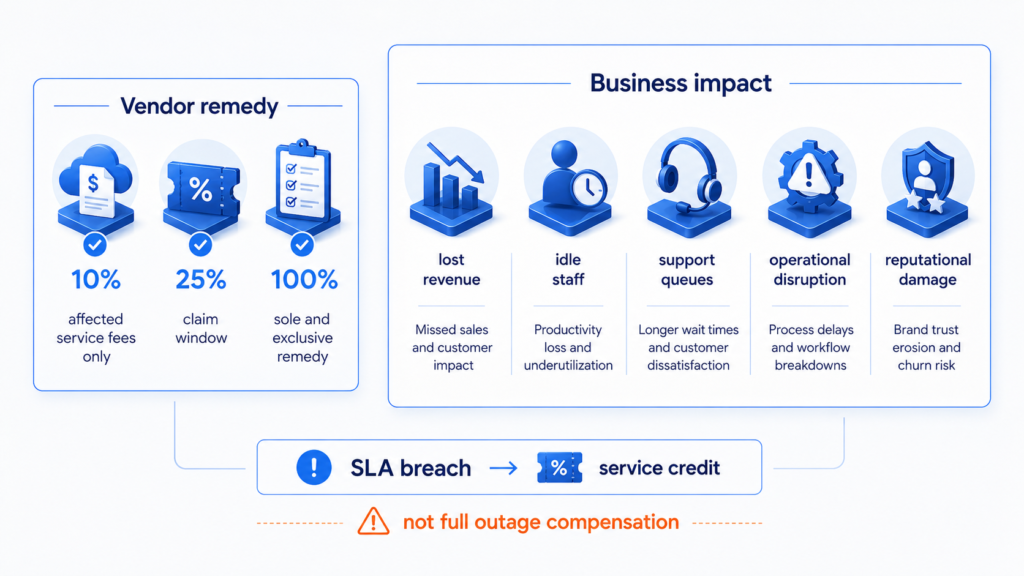
The credit mechanics compound the problem rather than solving it. Every major provider structures service credits the same way: a tiered percentage, typically 10%, 25% and 100%, applied only to the bill for the affected service, only if the customer notices the breach and files a claim inside a strict window, and explicitly described as the customer’s sole and exclusive remedy. None of that bears any relationship to what the outage actually cost. When CrowdStrike’s faulty sensor update took down 8.5 million Windows machines in July 2024, Delta’s chief executive told CNBC that the airline’s own losses reached around 500 million dollars, while CrowdStrike’s contractual liability was reported to sit in the single-digit millions. That is not a company behaving badly. That is the SLA doing exactly what it was written to do: cap the vendor’s exposure, not compensate the customer’s loss.
Measurement adds a third gap between the number on the page and the number your users feel. SLAs are calculated at the service boundary, over a full billing period, using each vendor’s own definition of downtime, which typically excludes scheduled maintenance and often excludes anything attributed to the customer’s own configuration. A service can fail badly for twenty minutes and still close the month inside its committed uptime percentage. When AWS’s DynamoDB DNS automation failed in October 2025, the outage cascaded through EC2, Lambda, IAM and a dozen other services in the same region, not because those services share an availability figure, but because they share control-plane infrastructure that sits outside any individual SLA entirely, the kind of shared building block explored in our guide to Azure’s regions, availability zones and paired regions. Status dashboards routinely lag real customer impact by hours during a live incident, because the monitoring and status-reporting systems are themselves dependencies on the infrastructure that just failed.
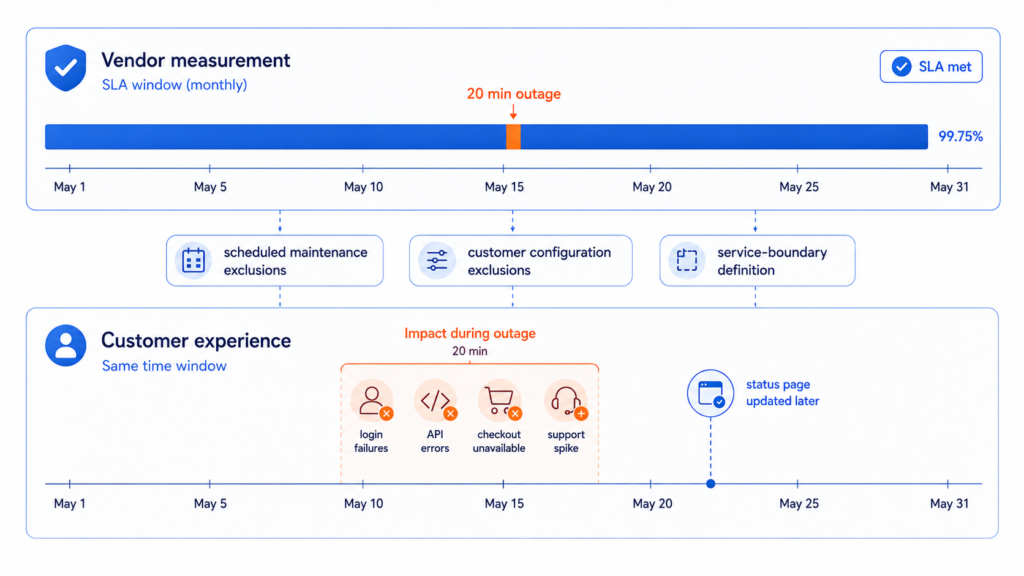
None of this is where most downtime actually comes from. Uptime Institute’s most recent annual outage analysis found that around four in five operators considered their most recent serious outage preventable with better internal process, and that IT and networking failures, dominated by change management and misconfiguration, are a growing share of impactful incidents. The categories doing the damage, deployments, configuration drift, expired certificates, are almost entirely outside SLA scope by design, because the SLA was written to describe provider infrastructure failure, not your Tuesday afternoon release. The composite number an engineer calculates from vendor SLAs alone excludes the largest source of real downtime before the multiplication even starts.
UK and EU regulation is quietly making this calculation mandatory rather than optional. The FCA’s operational resilience rules require regulated firms to set an impact tolerance, a maximum tolerable disruption measured in time, for every important business service, and to test against severe but plausible scenarios that explicitly include third-party and cloud provider failure. DORA imposes an equivalent obligation across the EU and has begun formally designating critical ICT third-party providers for direct oversight. Regulators are, in effect, requiring firms to write down the composite number that vendor SLAs were never designed to produce. Architecture teams that already reason about dependency chains and independent failover paths, the pattern explored in our guide to multi-region cloud architecture, are simply ahead of a requirement that is becoming statutory for regulated sectors and good practice everywhere else.
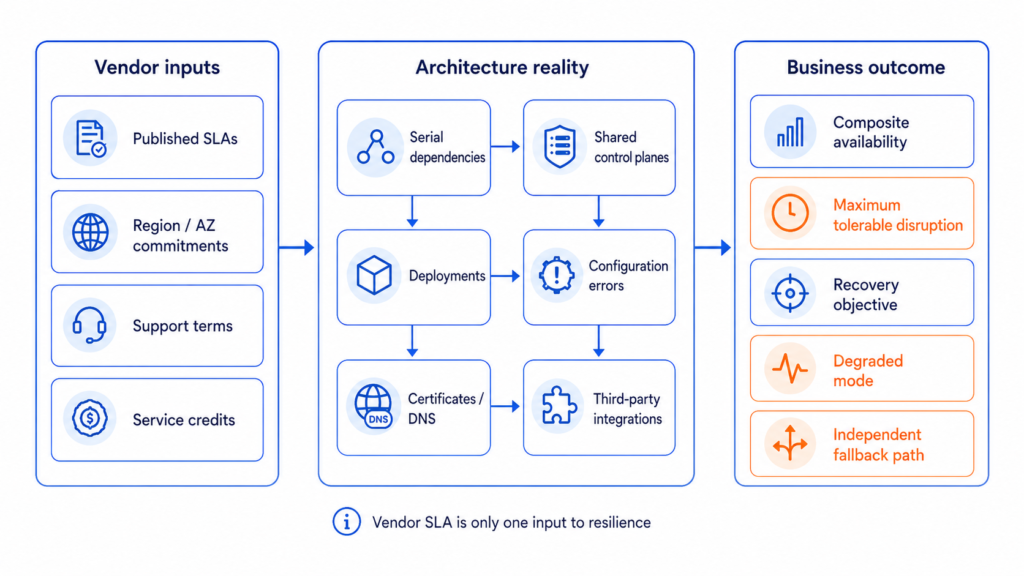
The composite number exists whether or not anyone calculates it. It is already determining how often your users see an error page, and no amount of quoting individual vendor SLAs in a design review changes that. The useful exercise is not more optimism about the inputs, it is honesty about the chain: list every serial dependency, including the provider’s own shared control-plane services, treat each published SLA as a ceiling rather than a reality, and reserve genuine architectural effort, independent fallback paths, cross-region redundancy, degraded-mode operation, for the points in the chain where the multiplication actually hurts. That audit takes an afternoon. Waiting for an incident to force it costs considerably more.
Useful Links
- AWS Compute SLA
- Amazon S3 Service Level Agreement
- Google Cloud Compute Engine SLA
- Azure: How to Read a Service-Level Agreement
- Azure Well-Architected Framework: Reliability Metrics
- Google SRE Book: Embracing Risk
- Uptime Institute: Annual Outage Analysis 2025
- ThousandEyes: AWS Outage Analysis, October 2025
- Parametrix: CrowdStrike’s Impact on the Fortune 500
- FCA: Operational Resilience