Most teams treat connection pool sizing as a configuration detail, the kind of thing you set once during initial deployment and revisit only when something breaks. That assumption is wrong, and the consequences of getting it wrong are asymmetric in a way that makes the problem hard to find. A pool that is too small fails loudly: connection timeout exceptions appear in logs, engineers find the root cause in under an hour, and the fix is a single configuration change. A pool that is too large fails quietly. Throughput peaks and then bends downward. Latency at the p99 climbs slowly. Every dashboard looks roughly healthy. The system is degrading, and the signal that it is degrading looks like noise.
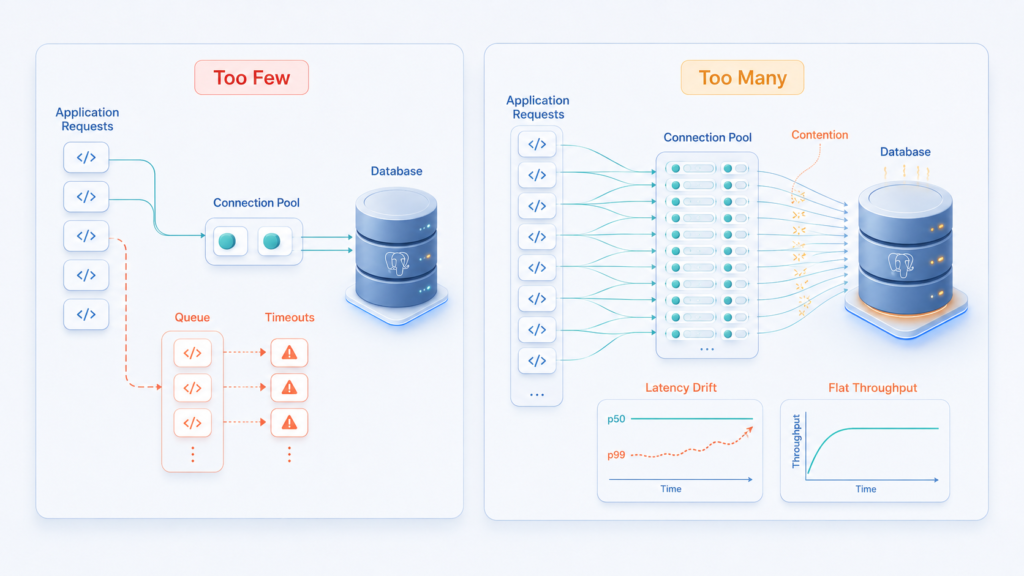
The reason the failure mode is asymmetric comes down to how relational databases execute queries. A database can only run as many queries simultaneously as it has cores. Connections beyond that number do not increase throughput; they sit waiting and impose overhead. Each idle PostgreSQL connection forks a backend process consuming memory. Each MySQL thread costs roughly 8 MB regardless of whether it is doing work. Past the point where active connections exceed the database’s vCPU count, additional connections produce context switching, lock-manager contention, and memory pressure. AWS has published benchmarking showing this explicitly: transaction rate peaks at a relatively small connection count and then falls as connections increase. Beyond a certain point, more connections mean less throughput.
The Multiplier Problem
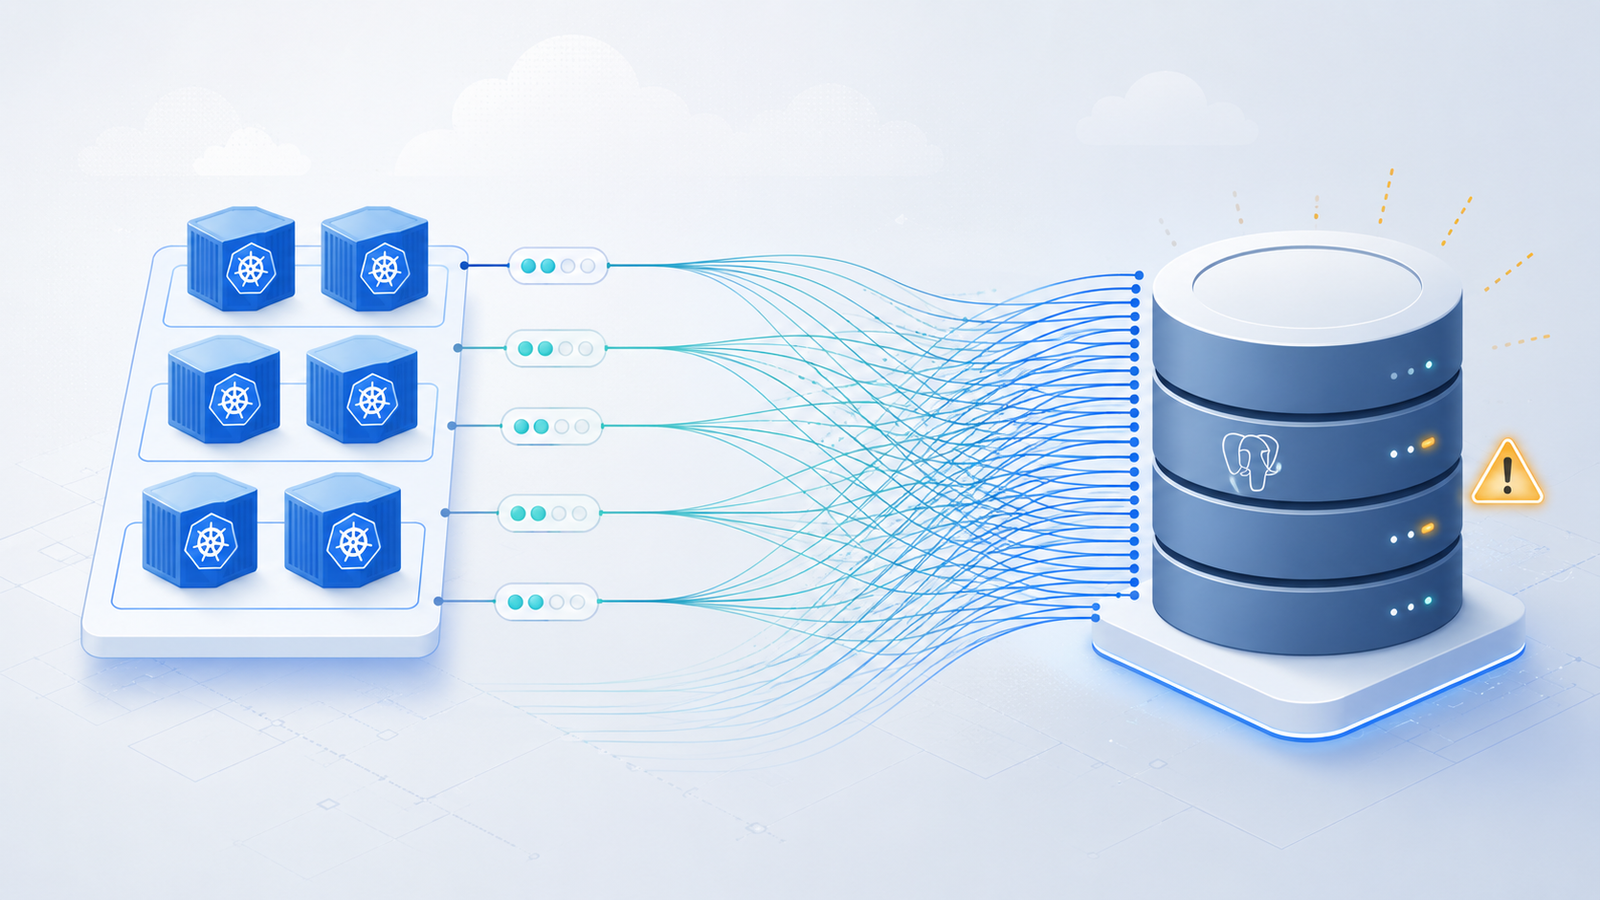
On-premises, pool sizing was simple arithmetic: fixed number of application servers, fixed pool size per server, total connections were known and stable. In cloud deployments that arithmetic becomes a moving variable. Total backend connections equal pool size multiplied by instance count, and in a horizontally scaled or autoscaling fleet, instance count is not a constant. A pool of 20 connections is invisible at five pods and becomes 600 connections when the autoscaler responds to a load spike. Serverless functions are more extreme still: each invocation can open its own pool, and a concurrent burst of several hundred functions against a single database is a scenario that no on-premises sizing calculation ever contemplated.
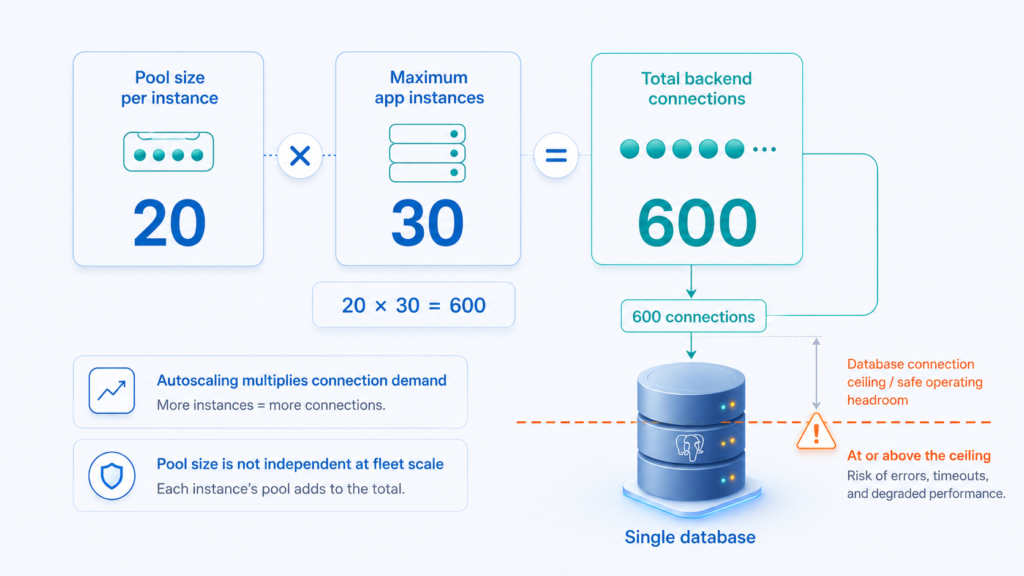
Managed database services impose hard ceilings that make this multiplication consequential. RDS for PostgreSQL derives its maximum connections from available instance memory, allocating roughly 9.5 MB per connection. A db.r6g.large can accommodate around 680 connections before hitting the limit, but reaching that ceiling and degrading performance are different thresholds: sustaining several hundred active connections against a modest instance will saturate it long before the absolute limit is breached. Cloud SQL ties limits directly to machine type, with the smallest instances permitting only 25 connections. Azure SQL’s Basic DTU tier allows 300, Standard S0 allows 600, and the limit scales from there. These numbers matter because once you model pool size against maximum pod count, many default configurations breach the ceiling or come uncomfortably close to it. For teams choosing between RDS engine types, the AWS RDS vs Aurora vs Database on EC2 guide covers how connection limits vary by deployment model and why that shapes the architecture decision.
The Defaults Are Wrong
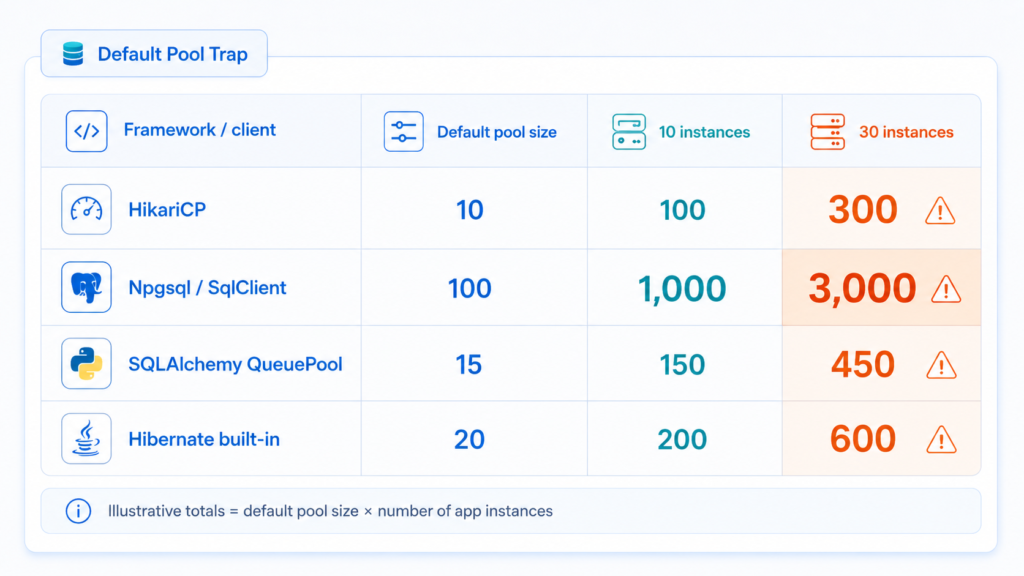
The defaults shipped by common clients and frameworks are calibrated for a single small application instance, not a fleet. HikariCP, the most widely used Java connection pool, defaults to a maximum pool size of 10. That default is conservative by design and correct for what the HikariCP maintainers document as the expected configuration on a 4-core database: roughly (cores × 2) + effective storage spindle count, which yields 9 to 10 connections. The problem is that this is the right number of backend connections for the database, not the right number of connections per application instance when many instances are running. The .NET ecosystem errs in the opposite direction: ADO.NET SqlClient and Npgsql both default Max Pool Size to 100. Ten application instances running Npgsql at default settings against one PostgreSQL database produces 1,000 backend connections before any load is applied. Hibernate’s built-in pooler caps at 20 and explicitly warns it is not intended for production use. SQLAlchemy’s QueuePool defaults to an effective ceiling of 15 per engine instance.
None of these defaults account for horizontal scale. That is the gap. When teams run containerised workloads, as with the Kubernetes patterns covered in Azure Kubernetes Service: Production-Grade Enterprise Implementation, the per-pod pool size must be divided against the database connection budget, not treated as an independent variable.
The Signals That Precede the Incident
Pool problems announce themselves in metrics before they become visible failures, but only if you are watching the right layer. At the pool layer, HikariCP exposes a metric for pending connection requests: threads waiting for a connection to become available. A consistently non-zero pending count means the pool is the bottleneck, not the database. PgBouncer’s client-waiting count serves the same function. At the database layer, Performance Insights’ DB Load metric tells you whether active connections exceed the instance’s vCPU count; sustained DB Load above vCPU count combined with flat throughput is the over-pooling signature. CloudWatch’s DatabaseConnections metric against the instance-class limit gives you the headroom figure. The rule of thumb is an alarm at 80 to 90 percent of the instance ceiling, but the more useful signal is the gap between connections and active queries: a large gap means connections are idle and consuming resources without contributing work.
The Val Town post-mortem published in 2024 is instructive. Deadlocked queries with no configured timeout permanently occupied pool slots, and health checks that tested process liveness rather than actual database connectivity left the service appearing healthy. The problem was invisible until requests began failing.
Where This Leaves the Architecture Decision
The correct starting point is not a default; it is an inequality. Pool size multiplied by maximum instance count must remain comfortably below the database connection ceiling, with headroom reserved for administrative connections, migration tooling, and failover. Where that inequality fails under realistic autoscaling assumptions, the right response is to introduce a pooler at the infrastructure layer: PgBouncer in transaction mode, RDS Proxy, or Cloud SQL Managed Connection Pooling. These multiplexers decouple the client-facing connection count from the backend connection count, allowing thousands of application connections to share a small, fixed set of server-side connections. The pool size inside the application then becomes less critical because the pooler acts as the backstop.
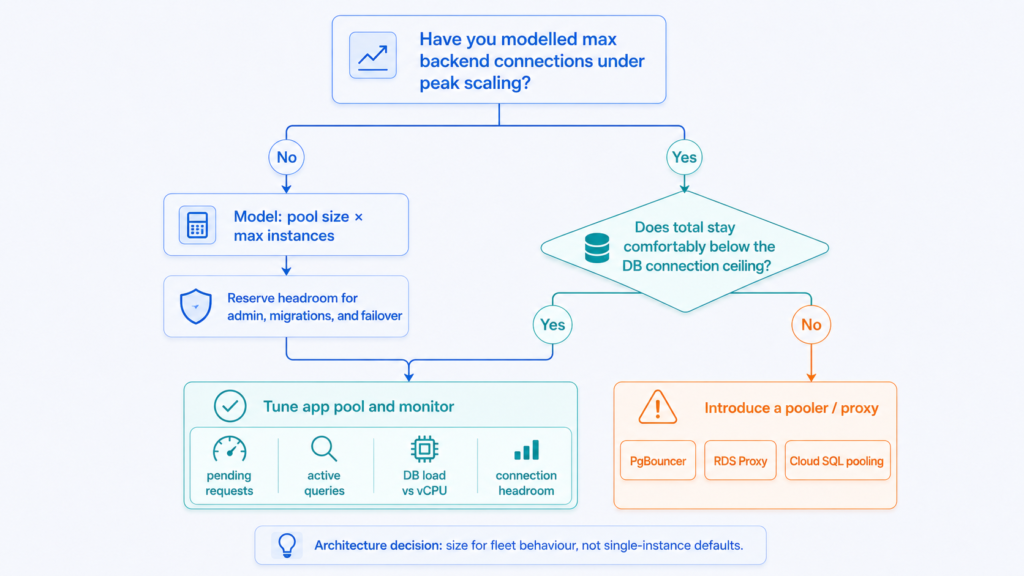
The practical question to ask of any production service is whether anyone has modelled total backend connections under peak scaling conditions. Not the pool size configured in the application. The total number of connections the database will receive when the autoscaler is at its ceiling. If that calculation has not been done, the default is doing the sizing, and the default was not written with your fleet in mind.
Useful Links
- HikariCP: About Pool Sizing
- AWS RDS Proxy configuration guidelines
- AWS: Performance impact of idle PostgreSQL connections
- Cloud SQL quotas and limits (PostgreSQL)
- Azure SQL Database resource limits by service tier
- SQLAlchemy connection pooling documentation
- PgBouncer documentation
- Val Town post-mortem: Exhausted host connection pool