
Most organisations that suffered a serious cloud outage in the past two years had a disaster recovery plan. The CrowdStrike incident of July 2024 took down roughly 25% of the Fortune 500 simultaneously, causing an estimated $5.4 billion in direct losses across healthcare, banking, aviation and retail. Almost every affected organisation had documented RTOs and RPOs. Almost none met them. The problem was not that they lacked a DR strategy: it was that the strategy they had chosen did not match the failure mode that actually arrived, and in many cases had never been tested under the conditions that triggered it.
The cloud vendor ecosystem has not helped. For years, the implicit message has been that choosing the “right” DR tier is primarily a technical question: how much can you spend, and how fast do you need to recover? In practice, the decision that breaks organisations is the one made earlier and quieter: treating every workload as though it has the same resilience requirement. When everything is theoretically covered by warm standby, nothing is actually protected at the level it needs to be, because the engineering complexity and operational discipline required for genuine warm standby are rationed across too many systems simultaneously.
This post provides a decision framework built around that reality. The question it answers is not “what is the cheapest DR tier?” but “which tier is appropriate for each workload class, given your actual cost of downtime, your team’s genuine operational capacity, and the failure modes most likely to hit you?” The framework maps onto equal coverage of AWS, Azure and GCP native capabilities, which have converged considerably since 2024 and now present meaningful architectural choices rather than a clear leader. It draws on verified case studies from Monzo, RS2 Smart Processing and Cintas, each representing a different tier and a different platform.
Why Tested DR and Written DR Are Not the Same Thing
The Uptime Institute’s 2024 Annual Outage Analysis reached a conclusion that should concern every platform architect: the dominant cause of major outages is no longer hardware failure. Software errors, configuration mistakes and operational failures by IT teams now account for the majority of significant incidents. This matters for DR architecture because the four canonical tiers (backup and restore, pilot light, warm standby, active-active) were designed primarily around regional hardware failures: datacentre fires, network partitions, power grid events. They are less effective against the software bugs and misapplied configurations that now drive most downtime.
The second finding that should shape architectural decisions is the cost trajectory. ITIC’s 2024 Hourly Cost of Downtime survey found that more than 90% of mid-size and large enterprises now lose over £240,000 per hour of unplanned downtime; 41% lose between £800,000 and £4 million per hour. Splunk’s equivalent research with Oxford Economics puts Global 2000 unplanned downtime at roughly $400 billion annually across the cohort, approximately $200 million per company per year. These figures represent costs that dwarf the annual run-rate of almost any DR investment, which is the point: the business case for serious resilience spend is not difficult to construct once the cost of downtime is accurately modelled against the cost of the DR tier.
The third structural problem is drift. DR environments decay from the moment they are built. IaC pipelines that deploy identically to both primary and recovery regions exist in theory; in practice, the recovery region receives fewer updates, its secrets rotation lags, its golden images are older, and its IAM policies diverge. An organisation that tested its warm standby eighteen months ago and has not tested it since should assume it will not meet its declared RTO. Rack2cloud’s framing is useful here: the difference between RTO (Recovery Time Objective) and RTA (Recovery Time Achieved) is what actually matters, and most organisations have never measured the latter.
The Four Tiers: What They Actually Mean in 2026
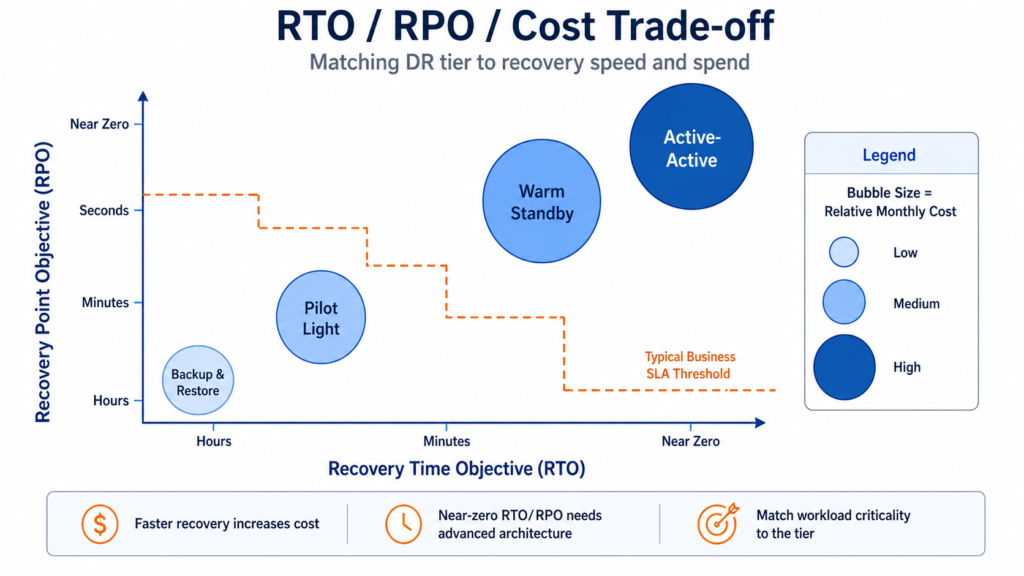
The cloud industry has standardised on four DR strategies, codified most clearly in the AWS Well-Architected Reliability pillar (which Azure and GCP guidance maps onto with different product names but identical logical structure). Understanding where the boundaries actually matters because the most expensive architectural mistakes come from conflating tiers: applying active-active to Tier-2 workloads because it felt safer, or applying backup-and-restore to Tier-1 workloads because it was cheaper.
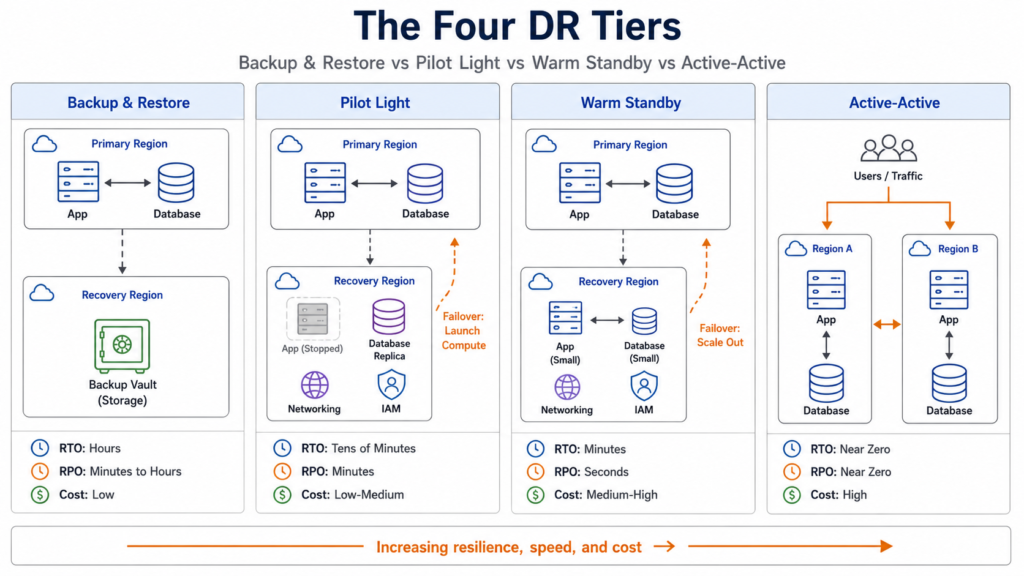
Backup and restore means exactly what it says: backups taken periodically, stored cross-region or cross-account, and restored from scratch on failover. RTO is measured in hours; RPO depends on backup frequency but with modern continuous backup services (AWS Backup with point-in-time recovery, Azure Backup, GCP Cloud SQL Enhanced Backups reached GA in December 2025) can drop to minutes. Nothing is pre-provisioned in the recovery region beyond storage. This is appropriate for Tier-3 workloads: reporting, analytics, dev/test environments, and systems that have same-day manual workarounds. It is entirely inappropriate for anything with a sub-four-hour business RTO.
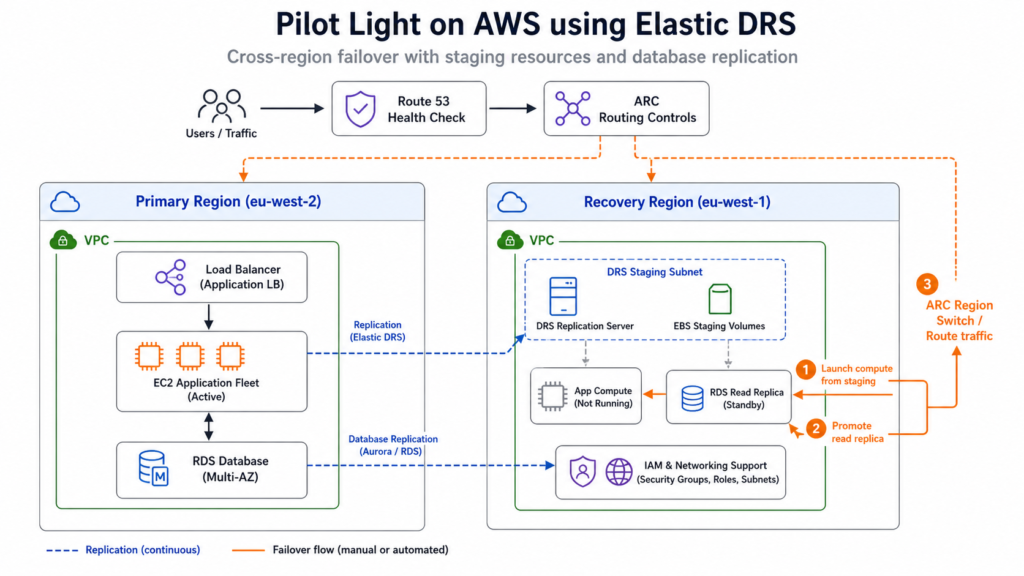
Pilot light keeps the data layer continuously replicated to the recovery region but deploys no application compute. Core networking, IAM, and database replicas are always running; EC2 instances, AKS node pools, GKE clusters, and application-tier VMs are not. On failover, you instantiate compute from pre-built images and promote replicas. AWS Well-Architected cites RPO in the minutes range and RTO in tens of minutes; with managed replication services (AWS Elastic Disaster Recovery, Azure Site Recovery, GCP Backup and DR Service) that are specifically designed to minimise staging compute costs, this can often be tightened further. The common misconception is conflating pilot light with warm standby: the acid test is whether the DR region can serve any production traffic without additional provisioning. If it cannot, it is pilot light, not warm standby, regardless of what the runbook says.
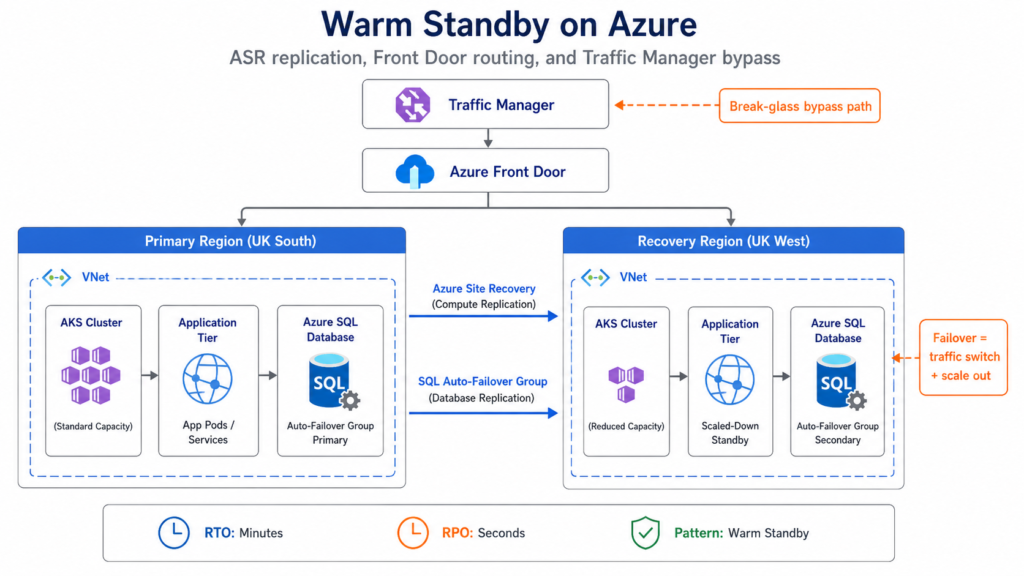
Warm standby runs a continuously operational but scaled-down version of the full production stack in the recovery region. The critical distinction is that it can serve traffic at reduced capacity immediately, with failover being primarily a scale-out operation plus a DNS or traffic-management flip rather than a provisioning exercise. RPO is typically seconds; RTO is minutes. When the DR region runs at full production capacity rather than reduced, the pattern becomes hot standby. Warm standby is appropriate for Tier-1 workloads: core SaaS platforms, primary customer-facing services, OLTP systems that have sub-one-hour business RTOs.
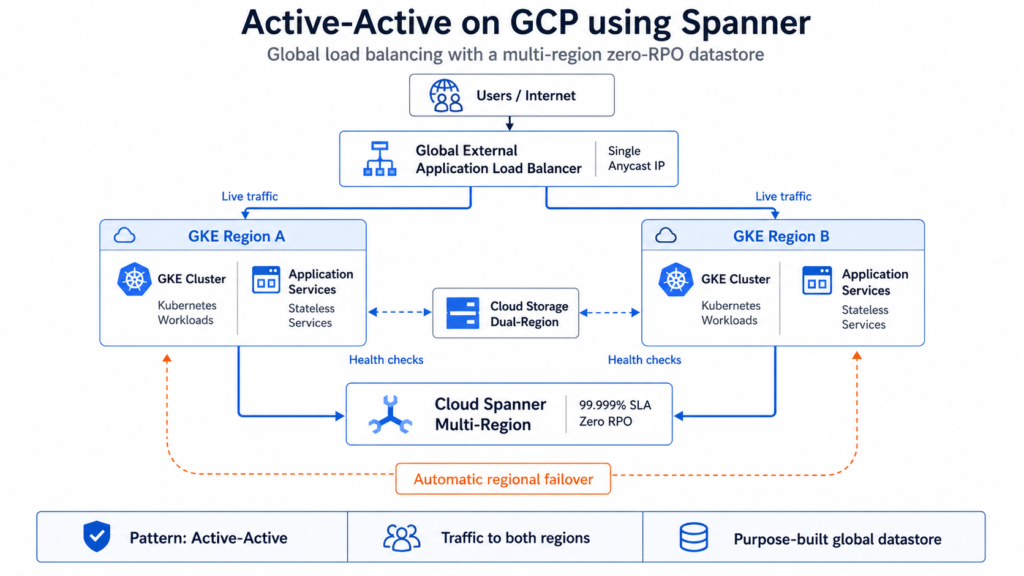
Multi-site active-active runs more than one region simultaneously under live production load, with cross-region replication and consistency guarantees determined by the datastore. RPO can approach zero for the right database architecture, but strongly consistent global writes require purpose-built systems and come with significant latency, cost, and design trade-offs. Spanner multi-region on GCP, Cosmos DB multi-region writes on Azure, and Aurora Global Database on AWS each support advanced multi-region resilience patterns, but they differ materially in write semantics, consistency guarantees, and failover behaviour. Spanner is the cleanest fit where globally consistent zero-RPO database behaviour is the primary requirement. Without a purpose-built datastore matched to those requirements, what organisations call active-active is often expensive warm standby with conflict-resolution complexity layered on top.
One pattern that does not fit cleanly into the four tiers has emerged from the Monzo engineering team: independent-software DR, which they call Stand-in. The thesis is that multi-region deployment of the same software does not protect against software bugs, and since software failures now dominate outage causes, the independence that matters is at the code level rather than the infrastructure level. Stand-in is covered in the case studies below and represents the direction that the most sophisticated regulated platforms are likely to move over the next few years, though it requires a level of platform engineering maturity that most organisations are not yet ready to operate.
Platform Coverage: AWS, Azure and GCP
AWS
The AWS DR toolset is the most prescriptive of the three platforms and the most vertically integrated. AWS Elastic Disaster Recovery (DRS) provides block-level replication from virtually any source (EC2, on-premises VMware, Hyper-V, physical servers, other clouds) into a lightweight staging subnet in AWS. Replication agents run on source servers and replicate continuously to a staging area: a small replication server instance plus EBS volumes in the recovery region. On failover, full-scale recovery instances launch from those staged volumes. The cost structure is relatively predictable: approximately $0.028 per source server per hour (around $20 per server per month) plus EBS staging storage and snapshot retention. For a representative 100-server estate with 30 TB of data and typical churn rates, the all-in cost runs to approximately $6,400 per month, compared with running a full warm standby fleet of equivalent capacity at roughly three times that figure on compute alone.
AWS Backup provides the centralised cross-region and cross-account backup management layer. A significant update in late 2025 introduced single-action cross-region plus cross-account copy for RDS, Aurora, Neptune and DocumentDB, removing the multi-step workaround previously required for encrypted instances. AWS Control Tower integration (covered in depth in our enterprise multi-account governance guide) auto-provisions centralised and local backup vaults across the OU hierarchy, which is the pattern you want for an enterprise estate rather than manually configuring backup policies per account.
For traffic management and failover orchestration, the AWS-native stack centres on Route 53 Application Recovery Controller (ARC). ARC Region Switch was introduced in 2025 and orchestrates multi-account, cross-region failover through routing controls with built-in safety rules and data-plane-oriented recovery operations: avoiding dependency on the AWS control plane during an active recovery. ARC’s predecessor, ARC Readiness Check, is being deprecated for new customers from April 2026; Region Switch plus safety rules is the current recommended pattern. AWS Resilience Hub rounds out the picture by providing RTO/RPO policy declarations, automated Well-Architected assessments, SOP generation via Systems Manager, and direct integration with AWS Fault Injection Service for game-day execution.
Azure
Azure’s DR story has consolidated significantly in the past eighteen months. Azure Business Continuity Center was introduced in 2024 and later expanded and renamed to Resiliency in Azure through 2025. The consolidated console now covers backup, Azure Site Recovery, ransomware protection and zone resiliency under a single governance view: a meaningful improvement over the previous fragmented experience across Backup Center, ASR blade and individual resource properties.
Azure Site Recovery remains the core managed replication product. It supports Azure-to-Azure VM replication and VMware replication using continuous replication, with replication frequency as low as 30 seconds in supported Hyper-V scenarios, plus physical server replication into Azure. The Ignite 2025 update added support for Ultra Disk and Premium SSD v2, and raised churn capacity to approximately 500 MB/s of disk activity, which opens ASR to workloads with busy database tiers that previously needed third-party tooling. Microsoft documents a one-hour RTO SLA for Azure-to-Azure VM failover, while achievable recovery time varies by workload type, replication scenario, automation, and runbook maturity. Microsoft published an official TCO calculator for ASR in February 2025. Pricing runs to approximately £13 to £20 per protected instance per month plus storage, egress, and capacity reservation costs; the exact figure depends heavily on the replication target (Azure-to-Azure is cheaper than customer-site-to-Azure).
For traffic management, Azure Front Door (global Anycast Layer-7 with health probe-based automated failover) and Azure Traffic Manager (DNS-based global routing) serve different roles. Importantly, following two Front Door global outages in October 2025, Microsoft has documented resiliency patterns that include Traffic Manager as a bypass option for reducing dependency risk around Front Door during control-plane events. This is a case where vendor guidance evolved in response to a real incident, and it is worth reviewing your traffic architecture if you deployed the earlier Front Door-only design.
Azure’s immutable backup vault capability, with multi-user authorisation for vault configuration changes and soft-delete protection, is now fully available across Azure Backup workloads following Ignite 2025 updates. This is the Azure equivalent of the air-gapped vault pattern that matters for ransomware resilience, and it aligns with the broader shift in how DR and backup are conceptually separated: replication protects you from infrastructure failure; immutable, retention-locked backups protect you from data corruption and ransomware.
GCP
GCP’s position on DR has historically attracted fair criticism: fewer out-of-box managed tools compared with AWS DRS or ASR, more assembly required, and a documentation pattern that assumed architectural sophistication from the outset. That picture has changed materially since 2024. GCP’s native tooling covers cloud-native workloads well, but mixed estates and on-premises recovery scenarios generally require more architectural assembly or partner tooling than the equivalent AWS DRS or Azure Site Recovery patterns.
The centrepiece is Backup and DR Service (formerly Google Cloud Backup and DR, built on the Actifio acquisition). Backup vaults for Compute Engine reached general availability in 2024 and added multi-region support in August 2025. Cloud SQL Enhanced Backups, which stores backups in a logically air-gapped, retention-locked vault separate from the primary instance, reached general availability in December 2025 for Enterprise and Enterprise Plus tiers. The service supports 1-hour backup frequency for Compute Engine workloads targeting sub-one-hour RPO, and SAP HANA integration using Persistent Disk snapshot and HANA Savepoints (delivering application-consistent recovery without Backint streaming).
For databases, the picture is more nuanced. Cloud SQL cross-region read replicas (asynchronous, non-zero RPO) exist across MySQL, PostgreSQL and SQL Server. Cloud SQL Enterprise Plus introduced advanced DR in 2024: simplified planned cross-region switchover with zero data loss under the new cascading replication model, targeting a two-minute recovery time for manual failover. The approach is covered in detail in Google Cloud’s Architecture Center reference documentation on data DR scenarios.
Spanner sits at the opposite end of the spectrum and deserves direct comparison with Aurora Global and Cosmos DB. Multi-region Spanner configurations (three or more regions) deliver a 99.999% SLA with synchronous Paxos replication and zero RPO. Google-managed automatic failover may take up to 45 minutes, while manual failover can be operator-initiated when faster recovery control is required. For database workloads where active-active is actually required, Spanner multi-region is architecturally the cleanest solution available across the three platforms, at the cost of a pricing model (per-node per-hour plus processing unit charges) that demands careful capacity planning. Our Cloud Spanner enterprise guide covers this in full.
For traffic management, GCP’s Global External Application Load Balancer uses a single Anycast IP with automatic regional failover via backend health checks. This is architecturally cleaner than a DNS-flip approach during failover because it eliminates TTL dependency: the IP remains constant and the load balancer routes around unhealthy backends without waiting for resolver cache expiry. Cloud DNS routing policies (weighted, geo, failover) are available for cases where DNS-level control is needed.
The gap that remains is block-level replication from non-GCP sources. There is no native equivalent of AWS DRS for VMware or on-premises workloads; partners including HYCU, Veeam and Veritas plug this gap, but it adds vendor selection complexity and licence cost that AWS and Azure avoid.
Case Studies
Company Name & Industry: RS2 Smart Processing Limited, Financial Services (Payment Processing)
Scale Context: Processes more than 7 million transactions per hour across 27 countries, 121 currencies; 44 servers in scope for the DR implementation
Challenge: RS2 needed to demonstrate PCI DSS-compliant cross-region DR with an annual full failover drill, replacing a legacy DR approach that could not meet audit requirements for a growing SaaS payment processor.
Solution Implemented: AWS Elastic Disaster Recovery deployed across 44 production servers (May to July 2022), replicating continuously into a staging subnet in a secondary AWS region. A full 24-hour cross-region failover and failback drill was completed in October 2022.
Measurable Outcomes:
- Full 24-hour cross-region failover drill completed successfully, satisfying PCI DSS annual audit requirements
- Cross-region resilience achieved for all 44 in-scope servers with seconds-class RPO
- Replicable test process established to support ongoing compliance evidence
Source: https://aws.amazon.com/solutions/case-studies/rs2-smart-processing-limited-case-study/
Company Name & Industry: Monzo Bank, Financial Services (UK Digital Bank)
Scale Context: Primary platform on AWS with more than 3,000 microservices serving millions of UK current account customers; Stand-in covers 18 core services (card payments, cash withdrawals, transfers, balance checks, card freeze)
Challenge: Monzo’s engineering leadership concluded that multi-region deployment of the same software on the same cloud does not protect against software failures, which now dominate cloud outage causes. A regional replica of the primary platform would share any code-level vulnerability that triggered an outage.
Solution Implemented: Stand-in: an independent banking platform built on Google Cloud with separate codebases, running a deliberately limited set of core payment services. Customer account state is asynchronously replicated from the AWS primary to GCP. A traffic-management layer can shift all payment processing from the primary platform to Stand-in in approximately 15 seconds. Stand-in is continuously validated in production via shadow testing, with a portion of live payment traffic processed through it at all times and scaled to 100% during daily peak load for capacity validation.
Measurable Outcomes:
- Stand-in infrastructure runs at approximately 1% of the cost of the primary platform (ongoing infrastructure cost, not total programme cost)
- Built in approximately 10 months before launch in March 2025
- First live invocation during an AWS outage in August 2024: payment processing continued without customer-visible disruption
- 15-second traffic shift achieved in production conditions
Source: https://monzo.com/blog/tolerating-full-cloud-outages-with-monzo-stand-in
Company Name & Industry: Cintas Corporation, Industrial Services (B2B Laundry and Facility Services)
Scale Context: More than 250 TB of SAP workloads protected under the implementation
Challenge: Cintas needed to reduce full SAP HANA backup duration and backup infrastructure cost while improving recovery reliability for a large, mission-critical SAP estate.
Solution Implemented: Google Cloud Backup and DR Service with Persistent Disk snapshot integration and SAP HANA Savepoints. The Savepoint integration delivers application-consistent snapshots at the database layer without requiring Backint streaming, reducing backup duration from hours to minutes and enabling significantly more frequent recovery points.
Measurable Outcomes:
- Full SAP HANA backup duration reduced from 1.5 to 3 hours to minutes per backup cycle
- Approximately 15% reduction in backup infrastructure costs (vendor-reported figure)
- Up to 50% storage cost reduction compared with traditional backup-to-file approaches (Google testing benchmark)
- 30%+ reduction in storage consumption in cold-DR scenarios versus Backint methodology
The Cost of Getting the Tier Wrong
The most reliable downtime cost reference for UK enterprise contexts comes from ITIC’s 2024 survey: more than 90% of mid-size and large enterprises now lose over $300,000 per hour of unplanned downtime. For banking, financial services, healthcare, manufacturing and utilities, average hourly outage costs exceed $5 million. Splunk’s 2024 research with Oxford Economics found that Global 2000 companies average approximately $200 million in downtime costs annually, representing roughly 9% of annual profits.
The practical implication is that the business case for serious DR investment almost always closes quickly once the arithmetic is done correctly. An organisation losing $500,000 per hour that experiences two significant outages per year, averaging four hours each, is losing $4 million annually. Pilot-light DR for a 100-server estate using AWS DRS costs approximately $77,000 per year in replication infrastructure. Even after adding engineering time, capacity reservations and testing costs, the investment-to-risk ratio is not difficult to justify to a CFO. The challenge is usually not the business case for DR itself: it is the business case for investing in a higher tier for a specific workload class.
Active-active is the tier where the ROI case requires the most rigour. Warm standby at database hot-standby configuration protects against regional infrastructure failure with minutes of RTO. The additional investment to move to active-active (running a second full production environment continuously, implementing globally consistent data replication, managing conflict resolution) is justified only when the business RTO is shorter than what warm standby can actually deliver, or when contractual SLAs or revenue concentration demand near-zero RTO. For most Tier-1 workloads, warm standby plus a well-tested runbook is the right answer. Active-active for everything is how organisations accumulate the operational complexity debt that causes incidents rather than preventing them.
The hidden costs that most DR cost models underestimate are worth naming: cross-region data egress (a write-heavy workload replicating 5 TB of changed data per month generates thousands of pounds in egress alone); capacity reservations in the recovery region (the only reliable way to guarantee compute is available during a regional incident, since spot and on-demand availability compresses precisely when you need it most); and runbook maintenance, which typically consumes 0.25 to 0.5 FTE per significant workload to keep IaC, images, secrets rotation and IAM aligned across regions. These costs are real and recurring; omitting them from the DR business case produces a plan that looks affordable until it has to be operated.
The Decision Framework
The framework operates on two inputs: workload tier classification and organisational DR operating capacity. Both are required; tier selection without an honest assessment of operational capacity produces DR commitments that will fail under pressure.
Workload classification assigns each production system to one of four tiers. Tier 0 covers mission-critical revenue or safety systems where every minute of downtime has a material business impact and where contractual or regulatory SLAs demand near-zero RTO: payments authorisation, real-time trading, critical clinical systems. These warrant active-active with a globally consistent datastore. Tier 1 covers business-critical systems with sub-one-hour business RTOs: core banking ledgers, e-commerce checkout, the primary SaaS service tier. Warm standby with hot-standby databases is the appropriate target. Tier 2 covers business-important systems with same-day workarounds available: ERP, CRM, batch processing, internal tooling. Pilot light using a managed replication service is the right pattern. Tier 3 covers everything else: reporting, analytics, development and test environments, archives. Backup and restore, with cross-region copies and tested restore procedures, is sufficient.
The classification exercise has a practical enforcement requirement: no more than 10% of production workloads should be classified as Tier 0. When everything is Tier 0, the engineering resources required to operate active-active at scale are rationed across too many systems, and the resulting quality of active-active for each is lower than genuine warm standby implemented well would be. Enforce the constraint by requiring a written business case from a system owner for every Tier-0 classification.
Organisational DR operating capacity is the second input. A platform team of four engineers cannot realistically operate active-active across three Tier-0 systems and warm standby across fifteen Tier-1 systems simultaneously: the on-call burden, the testing cadence, the drift management and the runbook currency requirements exceed available bandwidth. The discipline required is to match declared tier to actual operating capacity: if you cannot test failover quarterly, do not declare a one-hour RTO. If you do not have a 24/7 on-call team that can execute a failover decision within 15 minutes, active-active is unlikely to deliver its theoretical RTO in practice.
The practical thresholds that drive tier selection are relatively clear from the downtime economics. If your hourly cost of downtime for a workload is below £20,000 and you have manual same-day workarounds available, backup and restore is defensible. Between £20,000 and £100,000 per hour, pilot light is the appropriate floor. Above £100,000 per hour or with contractual 99.99% uptime SLAs, warm standby is the minimum. Above £800,000 per hour or with genuine zero-downtime requirements, active-active is justified, and the independent-software DR pattern that Monzo has demonstrated becomes worth serious consideration for organisations at that level of scale and regulated exposure.
Common decision errors are worth naming explicitly. The first is applying active-active for prestige rather than necessity: running two production environments continuously to achieve a theoretical RTO that the team could not actually execute in a real incident because the runbook has not been tested in six months. The second is treating multi-AZ as DR: multi-AZ protects against availability zone hardware failure; it does not protect against regional, identity-plane, or software failures. The hybrid cloud architecture patterns guide covers the distinction in more detail. The third is applying the same tier to the entire estate rather than classifying workloads individually, which is where most enterprise DR spend is wasted: Tier-3 systems consuming active-active budget that should be protecting Tier-1 systems properly.
Implementation Roadmap
Phase 1: Classification and Foundation (Months 1 to 3). The first deliverable is a formal workload register with tier assignments, signed off by business and engineering leadership jointly. This produces the constraint that governs all subsequent investment: you cannot determine the right DR architecture until you know the business cost of downtime per workload, the genuine RTO/RPO requirement per workload, and the volume of Tier-0 and Tier-1 systems you are actually committing to operate. During this phase, establish centralised backup and cross-region copy coverage for all Tier-2 and Tier-3 workloads (AWS Backup centralised policy via Control Tower, Azure Backup with immutable vaults, or GCP Backup and DR Service with backup vaults). This is the foundation layer and it is frequently missing even in organisations that believe they have DR covered.
Phase 2: Managed Replication Deployment (Months 4 to 9). Deploy managed replication for all Tier-1 workloads and begin warm standby builds. On AWS, this means DRS for server-class workloads and Aurora cross-region read replicas for the database tier (covered in the AWS RDS vs Aurora vs EC2 database strategy guide). On Azure, ASR for VM workloads and SQL auto-failover groups. On GCP, Backup and DR Service for Compute Engine plus Cloud SQL advanced DR for Enterprise Plus instances. Establish runbook automation (Systems Manager documents, Azure Automation runbooks, or GCP Workflows) and run the first game-day exercise for at least one Tier-1 workload before signing off the phase. Measure RTA against declared RTO; close the gap before moving to the next phase.
Phase 3: Active-Active and Continuous Validation (Months 10 to 18). For confirmed Tier-0 workloads, implement active-active with globally consistent data replication: Spanner multi-region, Aurora Global with write forwarding, or Cosmos DB multi-region writes depending on platform. Establish a continuous testing discipline: synthetic canary transactions in the DR region for warm standby workloads, chaos experiments (AWS Fault Injection Service, Azure Chaos Studio) on a monthly cadence for Tier-1, and quarterly full failover drills for all Tier-0 and Tier-1 systems. Implement drift detection as a CI/CD gate: policy-as-code checks that verify recovery-region IaC, image freshness, secrets currency, and quota headroom before declaring RTO compliance. The cloud-native backup comparison in the Cloud-Native Backups guide covers the observability patterns for backup pipeline health monitoring.
Strategic Recommendations
The single most important recommendation is to run a failover drill before publishing your RTO commitments externally, not after. The organisations that met their RTOs during the CrowdStrike incident had practised under conditions that resembled what actually happened: not just planned maintenance windows, but unexpected failures during peak load. If your most recent game day involved stopping VMs in a test environment at 14:00 on a Tuesday, your RTO claim for a 03:00 production failure is theoretical.
Beyond testing discipline, the architectural direction worth tracking is the independent-software DR pattern. Monzo’s Stand-in is the most credible public demonstration of an approach that protects against software failure rather than just infrastructure failure, and it does so at approximately 1% of primary-platform infrastructure cost. The barriers are real: you need mature platform engineering, separate codebases that can stay aligned on core data contracts without duplicating feature development, and the operational willingness to run shadow testing continuously in production. Most organisations are not ready for it now; the ones operating regulated platforms at significant scale should be planning toward it over the next two to three years.
Finally, the most underrated investment in DR is the workload register itself. Not the DR runbook, not the replication configuration, not the game-day schedule: the document that forces business owners and architects to agree, in writing, on what each system is actually worth per hour of downtime and what RTO/RPO target is actually required. Without that constraint, DR architecture drifts toward “everything is critical” and the budget is never quite sufficient, the team is never quite ready, and the plan never quite holds. The register is the instrument that makes everything else work.
Useful Links
- AWS Disaster Recovery of Workloads on AWS whitepaper
- AWS Elastic Disaster Recovery pricing
- RS2 Smart Processing case study (AWS DRS)
- Monzo Stand-in engineering blog post
- GCP Backup and DR Service for SAP HANA (Cintas)
- Azure Business Continuity Center / Resiliency in Azure
- Google Cloud Architecture Center: DR scenarios for data
- GCP Backup and DR Service (Backup vaults multi-region)
- ITIC 2024 Hourly Cost of Downtime survey
- AWS Resilience Hub