
Cloud spending continues its relentless march upward, with global expenditure forecast to reach £723.4 billion in 2025—a staggering 21.5% year-on-year increase. Yet amidst this growth lies a troubling reality: 69% of organisations exceed their cloud budgets, with an estimated 35% of spending wasted through overprovisioning and idle resources.
For CFOs navigating this landscape, FinOps (Financial Operations) has evolved from a technical necessity into a strategic imperative. The evidence is compelling: organisations implementing comprehensive FinOps programmes report 10-30% cost savings within the first year, with return on investment materialising in just 3-9 months.
This isn’t merely about cost-cutting anymore. Leading organisations like Capital One (£100+ million saved), Samsung (£11+ million saved), and McDonald’s (£20+ million saved) demonstrate that cloud financial management has become a competitive advantage—one that CFOs can quantify, measure, and defend to boards and stakeholders.

The Strategic Shift: From Cost Centre to Value Creator
The 2024 State of FinOps report reveals a fundamental change in organisational priorities. For the first time since 2020, “reducing waste” has overtaken “empowering engineers to take action” as the top FinOps priority. This shift signals CFO influence in cloud financial strategy and organisational maturity in treating cloud spend as a strategic asset rather than an unavoidable expense.
Consider the financial context: the average enterprise now spends £44 million annually on cloud services, with cloud infrastructure rising from 2.3% of IT operational budgets in 2021 to 5.7% in 2022. For high-growth software companies, cloud expenditure can reach 75-81% of cost of revenue, making optimisation critical for margin management.
This dramatic growth coincides with economic uncertainty. Only 12% of CFOs consider it an opportune time to take greater risks—down from 41% in 2023—according to Deloitte’s Q4 2024 CFO Signals survey. This risk-averse environment makes FinOps particularly compelling, offering both cost optimisation and predictability that CFOs desperately need.
The Four Pillars of FinOps Value Creation
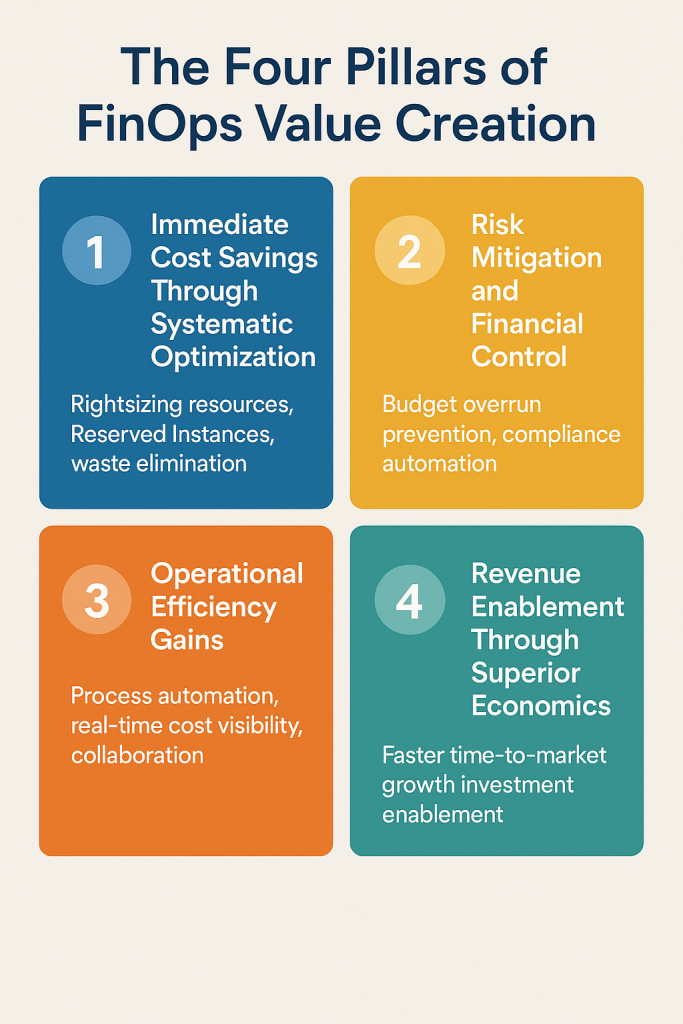
1. Immediate Cost Savings Through Systematic Optimisation
The most tangible FinOps benefits come through systematic cost reduction. Rightsizing resources typically yields 10-40% savings on compute costs by analysing utilisation metrics and matching resources to actual demand. One enterprise case study demonstrated a 76% cost reduction by moving from oversized instances to optimised configurations based on actual usage patterns showing maximum utilisation below 40% of capacity.
Reserved Instances and Savings Plans provide the most substantial immediate impact, delivering up to 75% savings off on-demand pricing. The median commitment coverage rate reached 55% in 2024, up from 28% in 2023, yet this still indicates significant untapped savings potential for most organisations.
Waste elimination offers immediate returns through identifying unused resources, orphaned storage, and unattached volumes. Industry data suggests this alone can reduce costs by 20-40% in the first quarter of implementation.
2. Risk Mitigation and Financial Control
CFOs increasingly value FinOps for risk management capabilities. Budget overrun prevention becomes quantifiable through variance tracking, with target variance below 8% compared to industry averages of 13%. Forrester notes that unrestricted autoscaling can consume annual budgets overnight, making this risk mitigation extremely valuable for financial planning.
Automated alerts with 24-hour response service level agreements transform small issues before they become major overruns. Financial governance prevents maverick spending that leads to budget surprises, whilst compliance automation saves 20-40% of manual effort whilst reducing breach risk.
3. Operational Efficiency Gains
Manual process automation typically reduces effort by 30-50% through automated cost analysis, reporting, and optimisation tasks. Real-time cost visibility versus 24-hour delayed native cloud tools reduces time from cost anomaly to resolution from days to hours.
Cross-team collaboration efficiency eliminates manual approvals that slow agile development, enabling faster deployment velocity and improved time-to-market. FinOps team productivity benchmarks show cost per pound managed of £0.05-£0.10 per pound saved, with utilisation rate targets of 70-85%.
4. Revenue Enablement Through Superior Economics
Perhaps most strategically valuable, FinOps enables revenue growth through better cloud economics. Faster time-to-market results from removing financial blockers that slow iteration cycles. Better resource allocation for growth enables accurate cost per customer, feature, and product line calculations that drive superior investment decisions.
Innovation investment enablement creates self-funding mechanisms where optimisation frees budget for strategic initiatives. One retail company reinvested FinOps savings into R&D for revenue growth, tracking the percentage of cloud savings reinvested in innovation programmes.
Measuring Success: ROI Metrics That Matter
The Gold Standard: Effective Savings Rate (ESR)
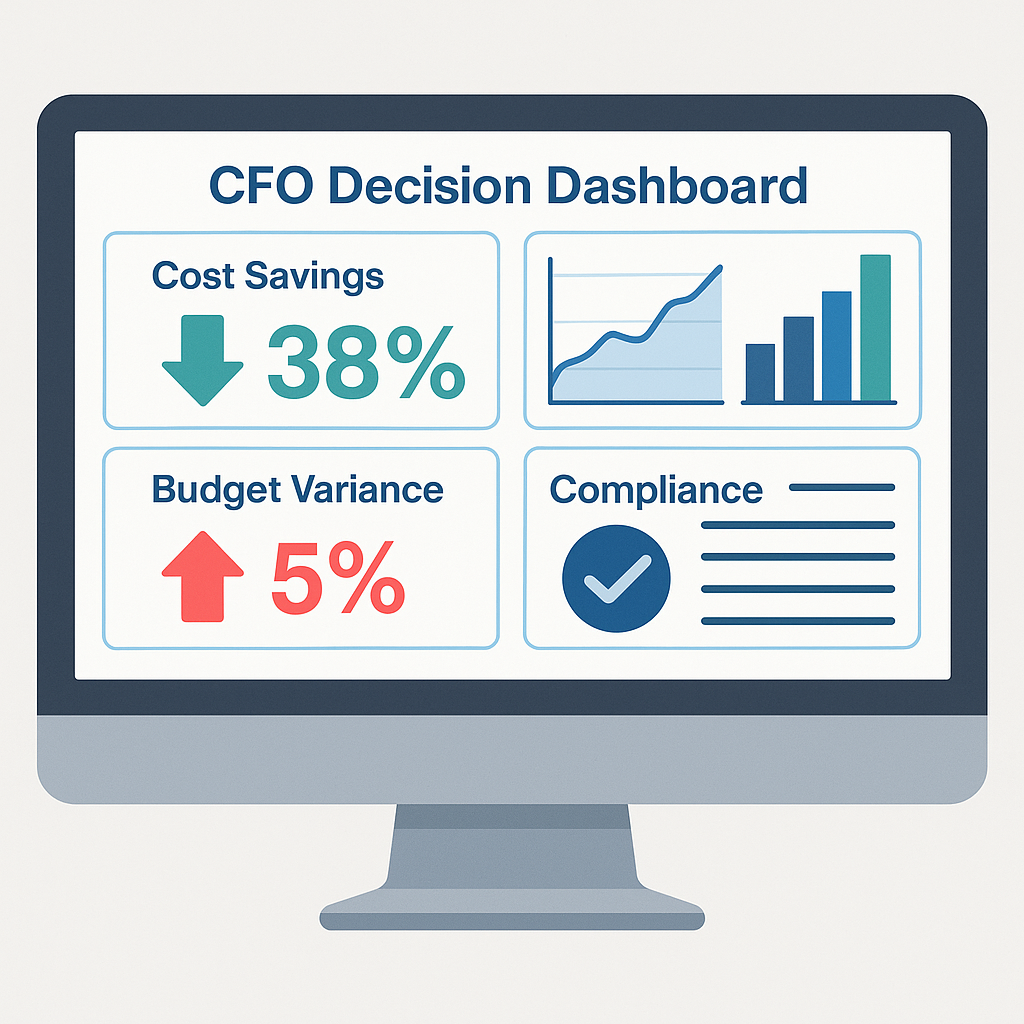
Effective Savings Rate has emerged as the premier metric for measuring FinOps performance. This metric calculates the return on investment for rate optimisation efforts, measuring actual savings percentage off list prices. Industry benchmarks show median AWS Compute ESR of 15% in 2024, with top performers achieving 38% for organisations with £10+ million annual compute usage.
Unit Economics for Business Context
CFOs respond best to metrics that align with familiar financial frameworks. Cost per employee (£7,614 annual IT spending per user), cost per transaction, cost per customer, and cost per application provide intuitive business context for cloud spending. These metrics enable CFOs to evaluate cloud efficiency using established financial criteria and compare performance across business units.
Traditional Financial Metrics
Return on Investment calculations using (Savings – Implementation Costs) / Implementation Costs × 100 provide clear payback analysis, with typical payback periods of 9-12 months for basic commitment discounts and 6-18 months for advanced optimisation programmes. Total Cost of Ownership analysis over 3-5 year periods demonstrates long-term value, with properly optimised cloud achieving 50%+ lower TCO than on-premises alternatives.
Implementation Timeline: When to Expect Returns
Quick Wins (0-3 months)
Immediate impact comes through compute discount instruments like Reserved Instances and Savings Plans, reducing compute costs by 30-40%. Basic rightsizing identifies oversized virtual machines and idle resources, whilst non-production environment scheduling shuts down development and testing environments during off-hours. Spot instance adoption provides up to 90% discounts for non-critical workloads.
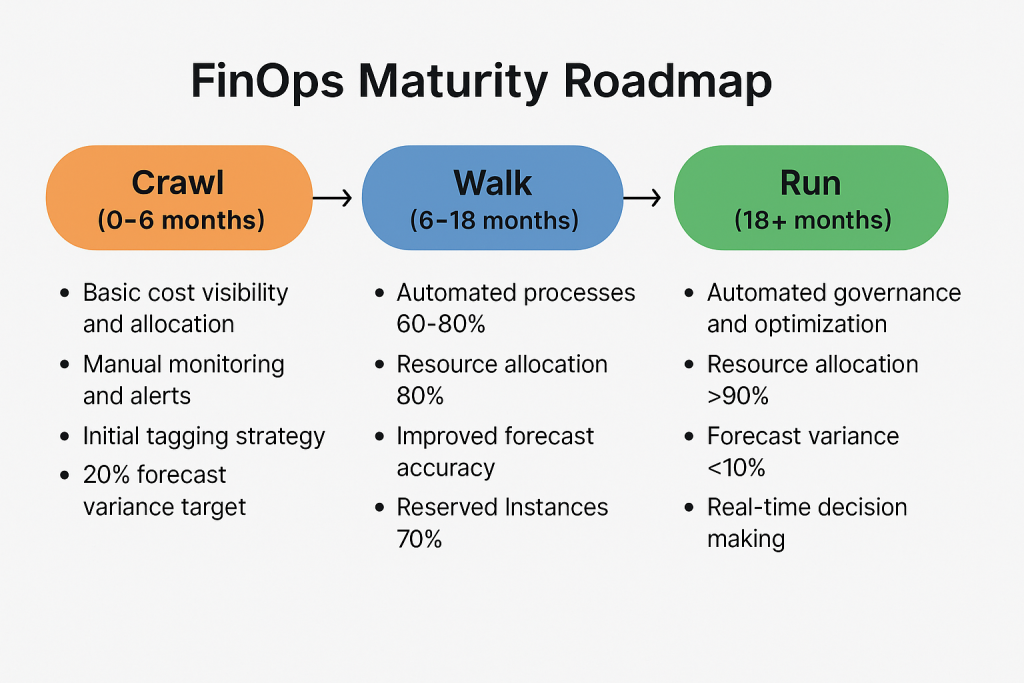
Crawl Phase (0-6 months)
This foundational period establishes basic cost visibility and allocation covering 50% of cloud spend, implements manual monitoring and basic alerts, deploys initial tagging strategies, and achieves forecast variance targets of 20% accuracy. This phase provides proof-of-concept value whilst building organisational confidence.
Walk Phase (6-18 months)
Advanced implementation achieves automated processes covering 60-80% of requirements, 80% resource allocation, improved forecast accuracy to 85%, and Reserved Instance coverage of 70%. Additional 20-30% savings result from structural changes and process maturation. Cross-functional FinOps teams become established, regular cost review cadences are implemented, and engineering teams become cost-aware in architectural decisions.
Run Phase (18+ months)
Mastery delivers full organisational adoption, automated governance and optimisation, active management of complex edge cases, >90% resource allocation and utilisation targets, and forecast variance <10%. Strategic value emerges through AI/ML-driven forecasting, real-time decision making, and complete alignment between cloud spend and business value.
Overcoming CFO Concerns: Common Objections and Solutions
“The ROI Isn’t Clear”
This affects organisations spending £10+ million monthly on cloud services. CFOs struggle to link cloud spend to business outcomes without clear metrics connecting engineering initiatives to revenue and customer satisfaction. The solution lies in implementing unit economics frameworks that correlate cloud investments with business performance indicators.
“Forecasting Is Too Difficult”
Variable, unpredictable cloud costs with 13% average budget overruns concern CFOs accustomed to predictable capital expenditure cycles. The transition from CapEx to OpEx models requires new budgeting approaches. Successful FinOps programmes address this through commitment strategies, automated alerts, and phased implementation that builds forecasting accuracy incrementally.
“We Lack Visibility and Control”
Organisations self-report 32% estimated cloud spend waste, indicating substantial governance gaps. This manifests through inability to trace costs to specific teams, difficulty allocating costs to financial categories, and complex multi-cloud billing. FinOps addresses these concerns through comprehensive tagging strategies, automated cost allocation, and unified multi-cloud visibility platforms.
Future-Proofing FinOps: Emerging Trends for 2025
AI Integration
90% of CFOs project higher AI budgets, with 71% planning 10%+ increases. Currently, only 31% of organisations report that AI/ML costs impact their FinOps practices, rising to 45% for large spenders above £100 million annually. This indicates AI cost management will become critical within 12-18 months as adoption accelerates.
Sustainability Integration
Less than 20% of FinOps teams currently collaborate with sustainability teams, but 50% expect this collaboration to become part of their role. CFOs increasingly need carbon accounting integrated with cloud financial management for ESG reporting and sustainability goal achievement.
Real-Time Capabilities
Organisations are shifting from quarterly to daily and real-time cost monitoring and decision-making. Most organisations still require human-in-the-loop approval for automated actions, balancing efficiency with governance requirements—aligning with CFO preferences for controlled automation rather than fully autonomous systems.
Making the Business Case: Presentation Strategies
When presenting FinOps ROI to executive audiences, lead with business impact rather than technical details. Structure presentations around current state pain points, clear value propositions tied to business objectives, and key recommendations upfront. Limit executive presentations to 10-12 slides, apply “So What?” tests for each slide, and include benchmark data against industry peers.
For board presentations, emphasise governance improvements, alignment with corporate sustainability goals, competitive positioning, and long-term financial sustainability. Content should address fiduciary responsibilities and stakeholder value creation that directors prioritise.
The Strategic Imperative
FinOps has evolved from cost management to strategic advantage. With proven ROI realisation timelines of 3-9 months and documented success stories exceeding £100 million in savings, FinOps represents one of the highest-return technology investments available to CFOs in 2024-2025.
The convergence of economic uncertainty, AI adoption, multi-cloud complexity, and sustainability requirements makes cloud financial management a strategic imperative rather than optional optimisation. CFOs who master FinOps frameworks gain competitive advantages through predictable cloud economics, faster innovation cycles, and superior resource allocation.
Success requires commitment to cultural transformation alongside technology implementation. The most successful programmes combine CFO-level sponsorship with cross-functional teams, systematic measurement frameworks, and phased implementation strategies that build momentum through documented quick wins.
As cloud spending approaches three-quarters of a trillion pounds globally, the financial stakes demand sophisticated management approaches that only mature FinOps programmes can provide. Organisations that embrace this transformation position themselves for sustainable competitive advantage in the cloud-native economy.
Useful Links for Further Reading
- FinOps Foundation Framework – Comprehensive guide to FinOps principles and maturity models
- Gartner Cloud Financial Management Tools Magic Quadrant – Industry analysis of FinOps tooling landscape
- Forrester FinOps Maturity Assessment – Framework for evaluating organisational FinOps capabilities
- ProsperOps Effective Savings Rate Benchmarks – Industry benchmarks for cloud commitment optimisation
- McKinsey FinOps Best Practices – Strategic perspective on cloud value realisation
- State of FinOps 2024 Report – Annual industry survey and trend analysis
- AWS Cloud Economics Centre – Cloud ROI calculation frameworks and business case templates
- Google Cloud FinOps Hub – Practical guidance for measuring cloud business value
- Deloitte CFO Signals Survey – Quarterly insights into CFO priorities and concerns
- CloudZero FinOps Resources – Technical implementation guides and case studies