
The intersection of cloud computing and environmental responsibility has moved from optional consideration to business imperative. As organisations worldwide commit to ambitious carbon reduction targets, cloud teams find themselves at the centre of sustainability efforts. The question is no longer whether to measure your cloud’s environmental impact, but how to do it effectively and what actions to take based on those measurements.
Microsoft Azure has responded with a comprehensive suite of sustainability tools that transform carbon footprint measurement from abstract reporting exercise into actionable optimisation strategy. These tools don’t just provide numbers, they deliver insights that simultaneously reduce environmental impact and operational costs.
The Current Sustainability Landscape
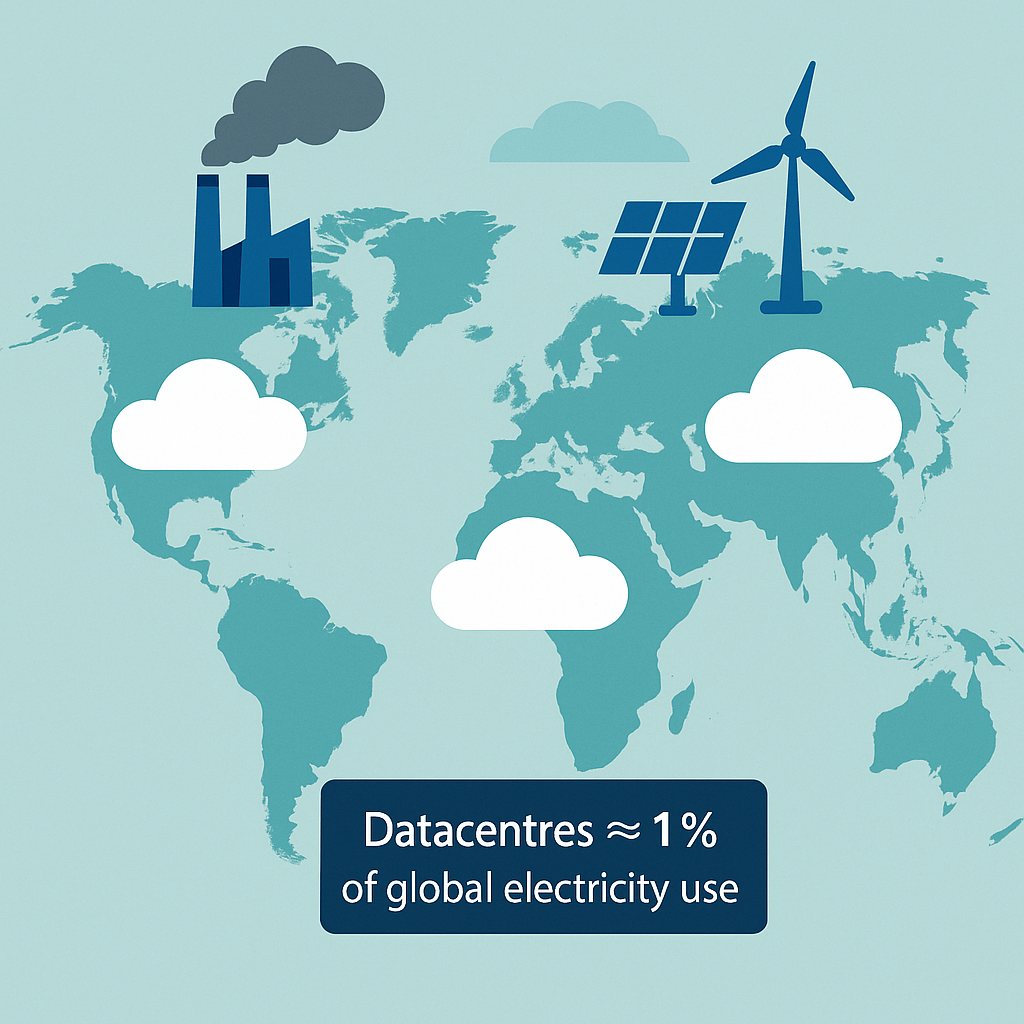
Global greenhouse gas emissions from the technology sector now match those of the aviation industry, with data centres responsible for approximately 1% of global electricity usage. Yet most cloud providers historically offered limited visibility into the carbon emissions generated by customer workloads. This transparency gap has made it challenging for organisations to baseline their cloud carbon footprint and implement meaningful reduction strategies.
The regulatory environment is evolving rapidly. The European Union’s Corporate Sustainability Reporting Directive (CSRD) began taking effect in February 2024, requiring companies to report on emissions as part of Environmental, Social, and Governance (ESG) compliance. Similar requirements are emerging globally, making carbon measurement a compliance necessity rather than a voluntary initiative.
Azure’s Three-Pillar Sustainability Approach
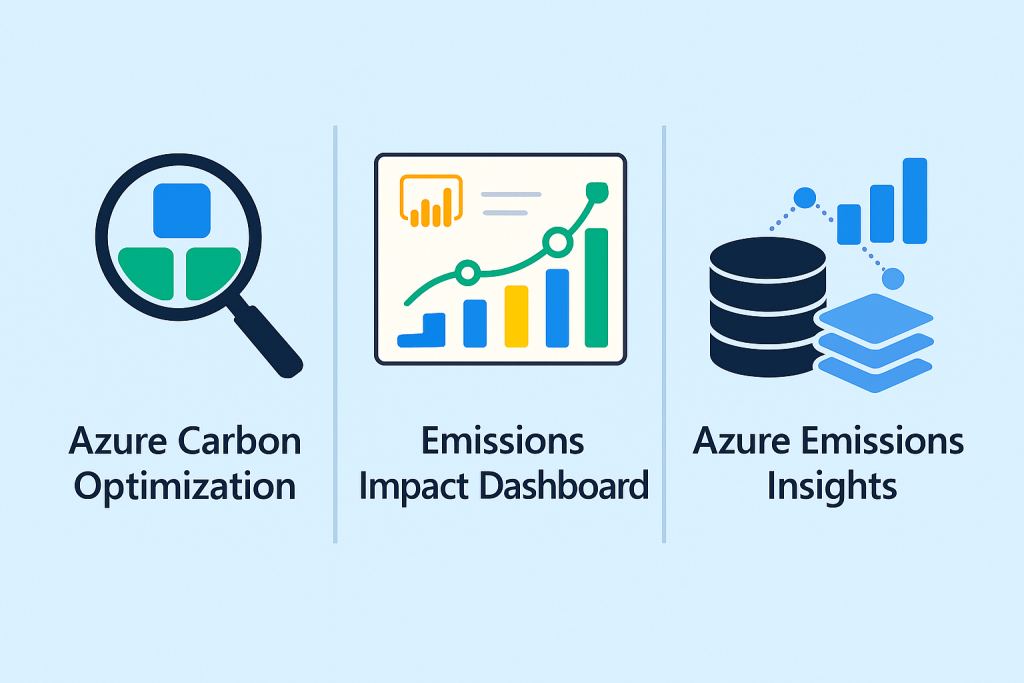
Microsoft’s sustainability strategy centres on three complementary tools, each designed for specific use cases and user groups:
1. Azure Carbon Optimization: Granular Resource-Level Insights
Launched in public preview in February 2024, Azure Carbon Optimization represents the most granular approach to cloud carbon measurement. This free tool provides emissions data at the resource level, enabling engineering teams to pinpoint exactly where optimisation opportunities exist.
The tool integrates seamlessly with Azure Advisor to deliver AI-driven recommendations that target both carbon reduction and cost savings. These might include rightsizing underutilised virtual machines, eliminating idle resources, or switching to more efficient SKUs. Each recommendation displays estimated carbon savings alongside cost implications, enabling teams to prioritise actions based on both environmental and financial impact.
Data becomes available monthly, with the previous month’s emissions accessible by the 19th of each month. The 12-month retention period provides sufficient historical context for trend analysis whilst maintaining data freshness for operational decision-making.
2. Emissions Impact Dashboard: Enterprise-Wide Reporting
The Emissions Impact Dashboard, originally introduced as the Microsoft Sustainability Calculator in 2020, addresses organisation-wide carbon reporting requirements. Built on Power BI, it provides comprehensive emissions tracking across Azure and Microsoft 365 services with up to five years of historical data.
This tool excels in supporting ESG reporting workflows and executive-level sustainability communications. The dashboard includes emissions equivalents, translating abstract carbon figures into relatable terms like smartphones charged or trees planted, which proves invaluable when communicating environmental impact to non-technical stakeholders.
3. Azure Emissions Insights: Advanced Analytics Platform
For organisations requiring sophisticated emissions analysis, Azure Emissions Insights leverages Microsoft Fabric to enable complex data queries and custom reporting. This preview capability allows data analysts to merge Azure emissions data with other organisational datasets, creating comprehensive sustainability dashboards that span multiple business dimensions.
The Science Behind the Measurements
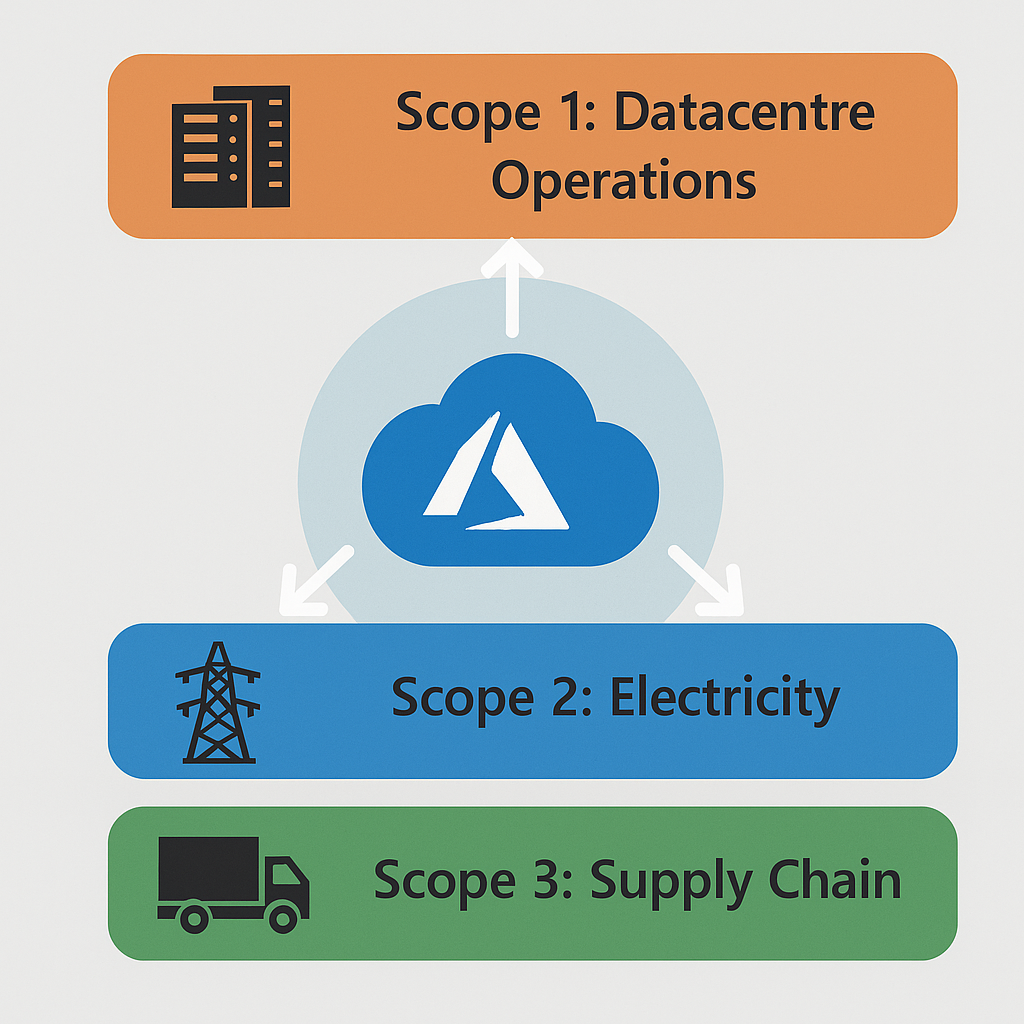
Understanding how Azure calculates carbon emissions builds confidence in the data and informs optimisation strategies. Microsoft’s methodology covers all three emission scopes as defined by the Greenhouse Gas Protocol:
Scope 1: Direct emissions from Microsoft’s datacentre operations, including backup generators and refrigerants
Scope 2: Indirect emissions from electricity consumption in datacentres
Scope 3: Emissions from hardware manufacturing, transportation, and end-of-life disposal
The calculation methodology underwent significant enhancement in February 2024, enabling more precise attribution of emissions to individual Azure resources rather than only subscription-level aggregation. This granularity proves crucial for teams seeking to optimise specific workloads or applications.
Microsoft’s approach allocates emissions based on relative Azure usage within each datacenter region. An algorithm calculates a usage factor that provides emissions per unit of customer consumption, then applies this factor to actual resource utilisation. This ensures that customers with higher resource efficiency receive proportionally lower emission allocations.
Implementing the Software Carbon Intensity Framework
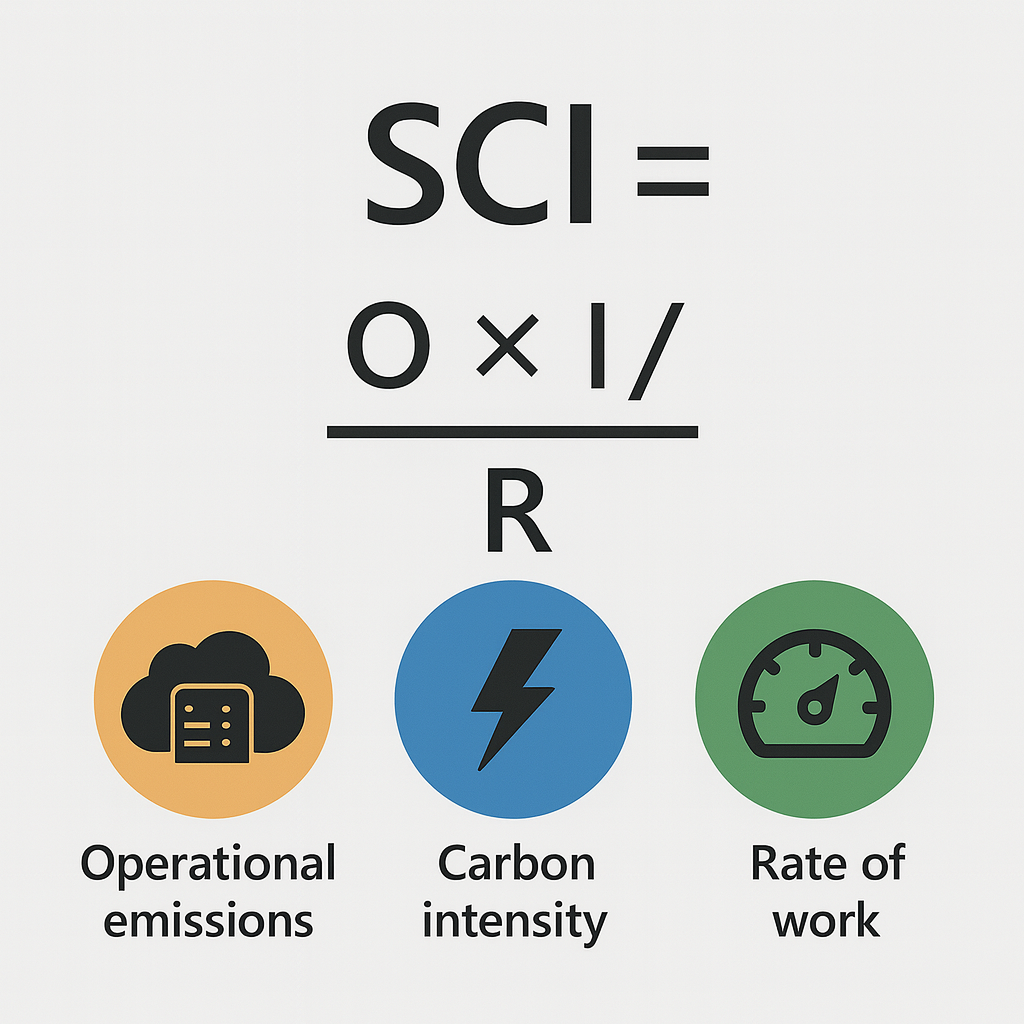
The Software Carbon Intensity (SCI) specification, developed by the Green Software Foundation and now recognised as international standard ISO/IEC 21031:2024, provides a standardised approach to measuring application-level carbon impact. Azure’s sustainability tools integrate seamlessly with SCI calculations, providing the data foundation necessary for accurate scoring.
SCI differs from traditional carbon accounting by focusing on rates rather than totals. This approach encourages continuous improvement by making the metric sensitive to efficiency gains. A lower SCI score indicates better carbon efficiency per unit of work performed.
Azure’s Carbon Optimization tool provides the operational emissions (O) component of SCI calculations through its detailed resource usage tracking. When combined with regional carbon intensity data and embodied emissions calculations, teams can establish baseline SCI scores and track improvements over time.
Real-World Success Stories
RELX: Comprehensive Carbon Management
RELX, a global information and analytics company, demonstrates how Azure sustainability tools integrate into broader corporate environmental strategies. The organisation built CO2.Hub, an Azure-based solution using Power BI that consolidates Scope 1, 2, and 3 emissions across all business operations.
The Emissions Impact Dashboard serves as a core component of this system, providing reliable cloud emissions data that integrates with other emission sources. This comprehensive approach enables RELX to present a complete carbon picture to stakeholders whilst identifying specific optimisation opportunities within their cloud infrastructure.
Bühler Group: Carbon Neutrality by 2030
The Bühler Group, a leader in food processing and advanced materials, leverages Azure sustainability tools as part of their ambitious carbon neutrality goal. By using the Emissions Impact Dashboard, Bühler accurately tracks Scope 3 emissions associated with Microsoft cloud services, contributing to a more complete understanding of their overall carbon footprint.
This granular visibility enables Bühler to make informed decisions about cloud resource allocation whilst maintaining the operational efficiency required for their global manufacturing operations.
Accenture: Application-Level Optimization
As a founding member of the Green Software Foundation, Accenture implemented SCI scoring across their internal applications. Their reference application achieved an SCI score of 0.025 gCO2 per API call, demonstrating how systematic measurement enables targeted optimisation efforts.
Accenture’s implementation highlighted the importance of accurate energy curve calculations and the value of combining multiple data sources to create comprehensive carbon profiles for software systems.
Practical Implementation Strategy
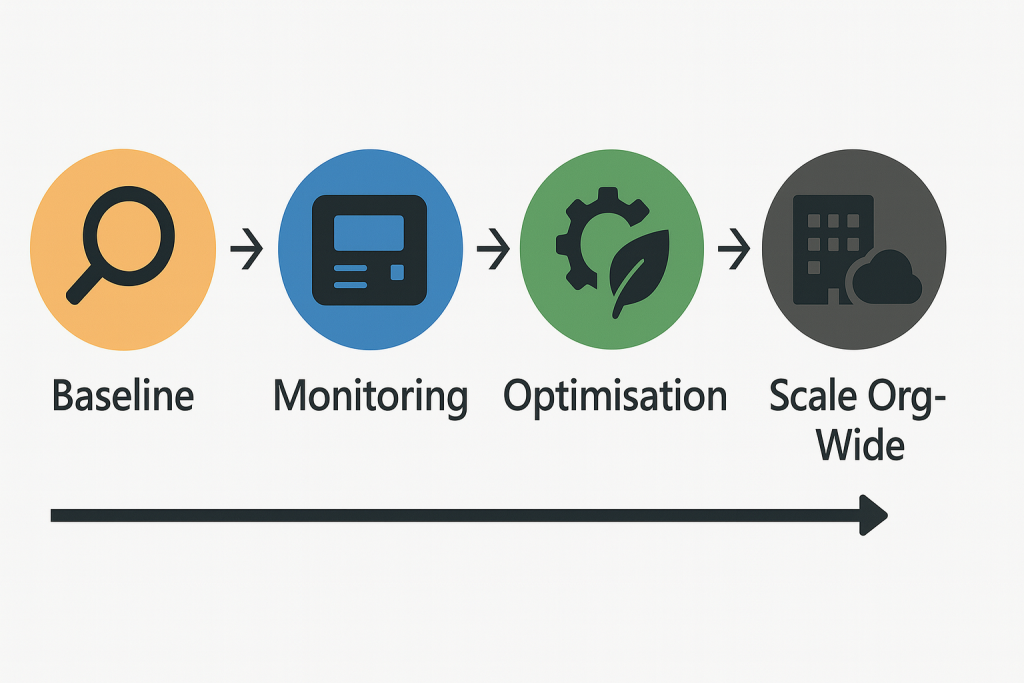
Phase 1: Establish Baseline Measurements
Begin with Azure Carbon Optimization to understand current emissions patterns. The tool’s intuitive interface provides immediate visibility into resource-level emissions without requiring complex setup procedures. Focus initially on identifying the highest-emitting resources and understanding their operational patterns.
Configure appropriate role-based access controls to ensure relevant team members can access emissions data whilst maintaining security boundaries. The Carbon Optimization Reader role provides sufficient permissions for most analytical tasks without broader administrative access.
Phase 2: Implement Systematic Monitoring
Establish regular monitoring workflows using the REST APIs or CSV export capabilities. Many organisations integrate this data into existing operational dashboards, creating a unified view of performance, cost, and carbon metrics.
Consider implementing automated alerting for significant emissions increases, enabling rapid response to configuration changes or unexpected resource scaling events.
Phase 3: Develop Optimisation Workflows
Translate carbon data into actionable optimisation strategies. Azure’s recommendations provide an excellent starting point, but custom analysis often reveals additional opportunities specific to particular workload patterns.
Document the relationship between application performance, resource utilisation, and carbon emissions for your specific workloads. This understanding enables informed trade-off decisions when balancing performance requirements against environmental impact.
Phase 4: Scale Across the Organisation
Once carbon optimisation workflows prove effective at the team level, expand visibility organisation-wide using the Emissions Impact Dashboard. This broader perspective supports strategic decision-making about cloud architecture, regional deployment strategies, and sustainability investment priorities.
Overcoming Common Implementation Challenges
Data Availability and Accuracy
Azure’s emissions calculations rely on industry-standard methodologies, but proxy measurements sometimes substitute for actual hardware-level data. Understanding these limitations helps set appropriate expectations for measurement precision whilst maintaining confidence in trend analysis and comparative assessments.
The monthly data update cycle requires planning for reporting workflows, particularly when aligning with quarterly business cycles or annual sustainability reporting requirements.
Integration with Existing Workflows
Carbon optimisation works best when integrated into existing operational processes rather than treated as a separate initiative. Many successful implementations combine carbon metrics with cost and performance data in unified dashboards, enabling holistic optimisation decisions.
Consider how carbon data integrates with existing monitoring tools, alerting systems, and change management processes. The goal is embedding sustainability considerations into routine operational decision-making rather than creating parallel workflows.
Balancing Performance and Sustainability
Not every carbon reduction opportunity aligns perfectly with performance or cost objectives. Developing clear prioritisation frameworks helps teams navigate these trade-offs whilst maintaining service quality standards.
Successful organisations often establish carbon budgets alongside cost budgets, creating explicit frameworks for evaluating optimisation trade-offs across multiple dimensions.
The Business Case for Cloud Carbon Measurement
Research consistently demonstrates strong correlation between resource efficiency, cost optimisation, and carbon reduction. Microsoft’s studies indicate that transitioning to Azure can deliver 72-98% carbon efficiency improvements compared to traditional datacenters, depending on specific workload characteristics and regional energy profiles.
Beyond environmental benefits, systematic carbon measurement supports several business objectives:
Regulatory Compliance: Proactive emissions tracking simplifies compliance with emerging ESG reporting requirements
Cost Optimisation: Carbon efficiency typically correlates with operational efficiency, reducing both environmental impact and operational expenses
Risk Management: Understanding emissions patterns helps anticipate and mitigate regulatory, reputational, and operational risks
Innovation Enablement: Resources freed through efficiency improvements can fund additional development initiatives
Looking Forward: The Evolution of Cloud Sustainability
Microsoft’s commitment to carbon negativity by 2030 and 100% renewable energy by 2025 provides a foundation for continued innovation in cloud sustainability tools. The integration of AI-driven optimisation recommendations suggests future developments may include automated carbon-aware workload management and predictive emissions modeling.
The standardisation of SCI methodology through ISO/IEC 21031:2024 creates opportunities for industry-wide carbon benchmarking and competitive analysis. As more organisations adopt systematic carbon measurement, industry benchmarks will emerge, enabling more sophisticated optimisation strategies.
Edge computing presents both opportunities and challenges for cloud carbon measurement. Distributed workloads complicate emissions attribution whilst potentially reducing overall energy consumption through localised processing. Azure’s sustainability tools will likely evolve to address these emerging architectural patterns.
Getting Started: Your Next Steps
Begin your Azure sustainability journey with these practical steps:
- Access Azure Carbon Optimization through the Azure portal to establish baseline emissions understanding
- Review current resource utilisation patterns to identify immediate optimisation opportunities
- Implement carbon metrics in existing monitoring and reporting workflows
- Establish optimisation priorities that balance carbon reduction with operational requirements
- Plan for systematic measurement using APIs or exports for ongoing monitoring
The tools exist, the methodologies are proven, and the business case is clear. The remaining barrier to effective cloud carbon management is organisational commitment to systematic measurement and optimisation.
Azure’s sustainability scoring capabilities transform environmental responsibility from compliance burden into operational advantage. Teams that embrace these tools discover that measuring and reducing cloud carbon footprint enhances rather than constrains their technical capabilities, whilst contributing to the broader goal of sustainable technology innovation.
Useful Links
- Azure Carbon Optimization Overview – Official Microsoft documentation for getting started
- Emissions Impact Dashboard for Azure – Enterprise-wide emissions tracking setup
- Software Carbon Intensity Specification – Green Software Foundation’s SCI methodology
- Azure Well-Architected Framework Sustainability Guidance – Best practices for sustainable Azure architectures
- Measuring Azure App Sustainability with SCI Score – Technical implementation guide
- Azure Carbon Optimization REST APIs – API documentation for programmatic access
- Microsoft Sustainability Commitments – Corporate sustainability strategy and progress
- Green Software Foundation – Industry standards and best practices for sustainable software
- Cloud Carbon Footprint Tool – Open-source alternative for multi-cloud carbon tracking
- Microsoft’s Carbon Benefits Research – Independent research on cloud vs on-premises efficiency